{"title":"计算机断层扫描衍生的放射组学模型用于区分难以诊断的炎性和恶性肺结节。","authors":"Shaohong Wu, Xiaoyan Wang, Wenli Shan, Jiao Ren, Lili Guo","doi":"10.1177/11795972251371467","DOIUrl":null,"url":null,"abstract":"<p><strong>Background: </strong>CT signs of inflammatory and malignant pulmonary nodules are shared and often confused, leading to difficulties in clinical differentiation. Previous relevant studies have neglected to explore the reclassification of morphological signs. This study was designed to evaluate radiomics based on CT images for distinguishing difficult-to-diagnose inflammatory and malignant pulmonary nodules.</p><p><strong>Methods: </strong>This retrospective study included 333 patients with malignant pulmonary nodules (Mn) and 161 patients with inflammatory pulmonary nodules (In) who were pathologically diagnosed between January 2017 and February 2024. According to whether the CT signs of pulmonary nodules were typical (typical: A or atypical: B), they were further divided into typical malignant nodules (MnA), atypical malignant nodules (MnB), typical inflammatory nodules (InA) and atypical inflammatory nodules (InB). Group 1 (MnA/InA), group 2 (InA/MnB), group 3 (MnA/InB), and group 4 (MnB/InB) were obtained by pairwise comparison. Clinical models, radiomics models and nomogram models were established for each group. The model performance was evaluated by the area under the curve (AUC), accuracy, sensitivity and specificity. The AUCs of the models were compared by using the DeLong test.</p><p><strong>Results: </strong>In the test set, the AUC values ranged from 0.63 to 0.82. In each group, the nomogram model had the highest diagnostic efficiency and had high accuracy, sensitivity and specificity. For group 3, the nomogram model had the best diagnostic ability (training set: AUC, 0.83; 95% CI [0.75-0.90]; accuracy, 0.72; sensitivity, 0.70; specificity, 0.84, test set: AUC, 0.82; 95% CI [0.70-0.94]; accuracy, 0.65; sensitivity, 0.96).</p><p><strong>Conclusions: </strong>The nomogram model was useful in diagnosing inflammatory and malignant nodules with typical or atypical signs, especially those with malignant signs, yielding a better classification performance than the radiomics and clinical model.</p>","PeriodicalId":42484,"journal":{"name":"Biomedical Engineering and Computational Biology","volume":"16 ","pages":"11795972251371467"},"PeriodicalIF":3.1000,"publicationDate":"2025-09-09","publicationTypes":"Journal Article","fieldsOfStudy":null,"isOpenAccess":false,"openAccessPdf":"https://www.ncbi.nlm.nih.gov/pmc/articles/PMC12420971/pdf/","citationCount":"0","resultStr":"{\"title\":\"Computed tomography-derived radiomics models for distinguishing difficult-to-diagnose inflammatory and malignant pulmonary nodules.\",\"authors\":\"Shaohong Wu, Xiaoyan Wang, Wenli Shan, Jiao Ren, Lili Guo\",\"doi\":\"10.1177/11795972251371467\",\"DOIUrl\":null,\"url\":null,\"abstract\":\"<p><strong>Background: </strong>CT signs of inflammatory and malignant pulmonary nodules are shared and often confused, leading to difficulties in clinical differentiation. Previous relevant studies have neglected to explore the reclassification of morphological signs. This study was designed to evaluate radiomics based on CT images for distinguishing difficult-to-diagnose inflammatory and malignant pulmonary nodules.</p><p><strong>Methods: </strong>This retrospective study included 333 patients with malignant pulmonary nodules (Mn) and 161 patients with inflammatory pulmonary nodules (In) who were pathologically diagnosed between January 2017 and February 2024. According to whether the CT signs of pulmonary nodules were typical (typical: A or atypical: B), they were further divided into typical malignant nodules (MnA), atypical malignant nodules (MnB), typical inflammatory nodules (InA) and atypical inflammatory nodules (InB). Group 1 (MnA/InA), group 2 (InA/MnB), group 3 (MnA/InB), and group 4 (MnB/InB) were obtained by pairwise comparison. Clinical models, radiomics models and nomogram models were established for each group. The model performance was evaluated by the area under the curve (AUC), accuracy, sensitivity and specificity. The AUCs of the models were compared by using the DeLong test.</p><p><strong>Results: </strong>In the test set, the AUC values ranged from 0.63 to 0.82. In each group, the nomogram model had the highest diagnostic efficiency and had high accuracy, sensitivity and specificity. For group 3, the nomogram model had the best diagnostic ability (training set: AUC, 0.83; 95% CI [0.75-0.90]; accuracy, 0.72; sensitivity, 0.70; specificity, 0.84, test set: AUC, 0.82; 95% CI [0.70-0.94]; accuracy, 0.65; sensitivity, 0.96).</p><p><strong>Conclusions: </strong>The nomogram model was useful in diagnosing inflammatory and malignant nodules with typical or atypical signs, especially those with malignant signs, yielding a better classification performance than the radiomics and clinical model.</p>\",\"PeriodicalId\":42484,\"journal\":{\"name\":\"Biomedical Engineering and Computational Biology\",\"volume\":\"16 \",\"pages\":\"11795972251371467\"},\"PeriodicalIF\":3.1000,\"publicationDate\":\"2025-09-09\",\"publicationTypes\":\"Journal Article\",\"fieldsOfStudy\":null,\"isOpenAccess\":false,\"openAccessPdf\":\"https://www.ncbi.nlm.nih.gov/pmc/articles/PMC12420971/pdf/\",\"citationCount\":\"0\",\"resultStr\":null,\"platform\":\"Semanticscholar\",\"paperid\":null,\"PeriodicalName\":\"Biomedical Engineering and Computational Biology\",\"FirstCategoryId\":\"1085\",\"ListUrlMain\":\"https://doi.org/10.1177/11795972251371467\",\"RegionNum\":0,\"RegionCategory\":null,\"ArticlePicture\":[],\"TitleCN\":null,\"AbstractTextCN\":null,\"PMCID\":null,\"EPubDate\":\"2025/1/1 0:00:00\",\"PubModel\":\"eCollection\",\"JCR\":\"Q3\",\"JCRName\":\"ENGINEERING, BIOMEDICAL\",\"Score\":null,\"Total\":0}","platform":"Semanticscholar","paperid":null,"PeriodicalName":"Biomedical Engineering and Computational Biology","FirstCategoryId":"1085","ListUrlMain":"https://doi.org/10.1177/11795972251371467","RegionNum":0,"RegionCategory":null,"ArticlePicture":[],"TitleCN":null,"AbstractTextCN":null,"PMCID":null,"EPubDate":"2025/1/1 0:00:00","PubModel":"eCollection","JCR":"Q3","JCRName":"ENGINEERING, BIOMEDICAL","Score":null,"Total":0}
Computed tomography-derived radiomics models for distinguishing difficult-to-diagnose inflammatory and malignant pulmonary nodules.
Background: CT signs of inflammatory and malignant pulmonary nodules are shared and often confused, leading to difficulties in clinical differentiation. Previous relevant studies have neglected to explore the reclassification of morphological signs. This study was designed to evaluate radiomics based on CT images for distinguishing difficult-to-diagnose inflammatory and malignant pulmonary nodules.
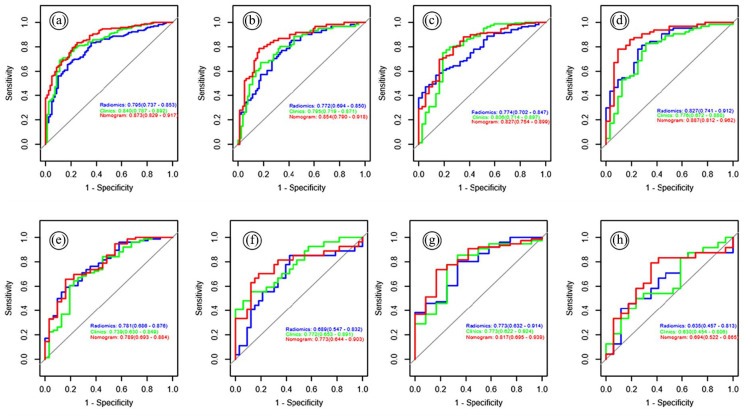
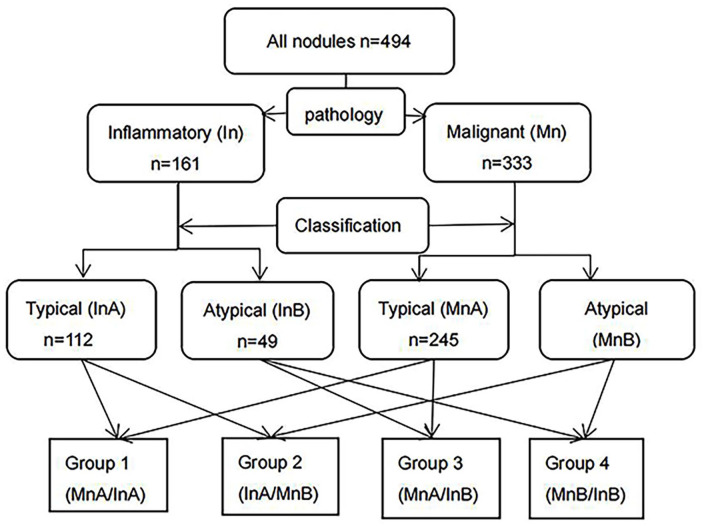
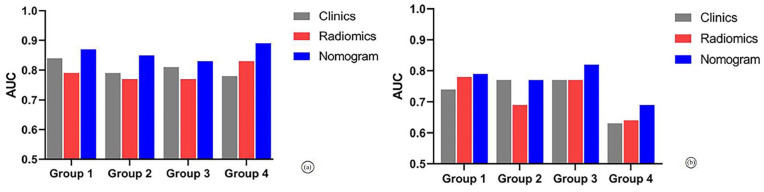
Methods: This retrospective study included 333 patients with malignant pulmonary nodules (Mn) and 161 patients with inflammatory pulmonary nodules (In) who were pathologically diagnosed between January 2017 and February 2024. According to whether the CT signs of pulmonary nodules were typical (typical: A or atypical: B), they were further divided into typical malignant nodules (MnA), atypical malignant nodules (MnB), typical inflammatory nodules (InA) and atypical inflammatory nodules (InB). Group 1 (MnA/InA), group 2 (InA/MnB), group 3 (MnA/InB), and group 4 (MnB/InB) were obtained by pairwise comparison. Clinical models, radiomics models and nomogram models were established for each group. The model performance was evaluated by the area under the curve (AUC), accuracy, sensitivity and specificity. The AUCs of the models were compared by using the DeLong test.
Results: In the test set, the AUC values ranged from 0.63 to 0.82. In each group, the nomogram model had the highest diagnostic efficiency and had high accuracy, sensitivity and specificity. For group 3, the nomogram model had the best diagnostic ability (training set: AUC, 0.83; 95% CI [0.75-0.90]; accuracy, 0.72; sensitivity, 0.70; specificity, 0.84, test set: AUC, 0.82; 95% CI [0.70-0.94]; accuracy, 0.65; sensitivity, 0.96).
Conclusions: The nomogram model was useful in diagnosing inflammatory and malignant nodules with typical or atypical signs, especially those with malignant signs, yielding a better classification performance than the radiomics and clinical model.

 求助内容:
求助内容: 应助结果提醒方式:


