{"title":"从2015年到2024年,英国的空气质量有了明显改善,但超标现象仍然很普遍","authors":"James Weber and Helen F. Dacre","doi":"10.1039/D5EA00055F","DOIUrl":null,"url":null,"abstract":"<p >The impact of poor air quality (AQ) on public health has long been recognised and considerable efforts have been made to improve it across the UK. The UK has a far reaching AQ monitoring network and this study summarises the evolution of UK AQ over the period 2015–2024, focusing on the pollutants NO<small><sub>2</sub></small>, O<small><sub>3</sub></small> and PM<small><sub>2<em>.</em>5</sub></small> and exploring their drivers. Concentrations of NO<small><sub>2</sub></small> and PM<small><sub>2<em>.</em>5</sub></small> exhibit robust negative trends across the whole country while concentrations of O<small><sub>3</sub></small> increase. Comparing 2015–2016 to 2023–2024, the median number of days per year for which DEFRA AQ sites breached the WHO 2021 target decreased from 136 to 40 (−70%) for NO<small><sub>2</sub></small> and from 60 to 22 (−63%) for PM<small><sub>2<em>.</em>5</sub></small>. This trend was mirrored in other AQ monitoring networks and highlights that, while progress is being made, acceptable levels of AQ are yet to be reached. Over the same period, median O<small><sub>3</sub></small> exceedances increased from 7 to 14 days per year. Nationwide analysis of diurnal variation in the pollutants and the use of airmass back trajectory clustering and statistical modelling for three locations – Reading, Sheffield and Glasgow – suggests that local traffic plays a dominant role in NO<small><sub>2</sub></small> pollution, PM<small><sub>2<em>.</em>5</sub></small> is influenced more by long range transport and O<small><sub>3</sub></small> increases are being driven in part by decreases in NO<small><sub>2</sub></small>. From an AQ policy perspective, this suggests continued focus on traffic emissions will reduce NO<small><sub>2</sub></small>, (inter)national rather than local efforts are most critical for PM<small><sub>2<em>.</em>5</sub></small> improvements, and reductions to VOC emissions must accompany NO<small><sub>2</sub></small> if further O<small><sub>3</sub></small> increases are to be avoided.</p>","PeriodicalId":72942,"journal":{"name":"Environmental science: atmospheres","volume":" 9","pages":" 987-997"},"PeriodicalIF":3.5000,"publicationDate":"2025-07-15","publicationTypes":"Journal Article","fieldsOfStudy":null,"isOpenAccess":false,"openAccessPdf":"https://pubs.rsc.org/en/content/articlepdf/2025/ea/d5ea00055f?page=search","citationCount":"0","resultStr":"{\"title\":\"UK air quality showed clear improvement from 2015 to 2024 but breaching of targets remains very common†\",\"authors\":\"James Weber and Helen F. Dacre\",\"doi\":\"10.1039/D5EA00055F\",\"DOIUrl\":null,\"url\":null,\"abstract\":\"<p >The impact of poor air quality (AQ) on public health has long been recognised and considerable efforts have been made to improve it across the UK. The UK has a far reaching AQ monitoring network and this study summarises the evolution of UK AQ over the period 2015–2024, focusing on the pollutants NO<small><sub>2</sub></small>, O<small><sub>3</sub></small> and PM<small><sub>2<em>.</em>5</sub></small> and exploring their drivers. Concentrations of NO<small><sub>2</sub></small> and PM<small><sub>2<em>.</em>5</sub></small> exhibit robust negative trends across the whole country while concentrations of O<small><sub>3</sub></small> increase. Comparing 2015–2016 to 2023–2024, the median number of days per year for which DEFRA AQ sites breached the WHO 2021 target decreased from 136 to 40 (−70%) for NO<small><sub>2</sub></small> and from 60 to 22 (−63%) for PM<small><sub>2<em>.</em>5</sub></small>. This trend was mirrored in other AQ monitoring networks and highlights that, while progress is being made, acceptable levels of AQ are yet to be reached. Over the same period, median O<small><sub>3</sub></small> exceedances increased from 7 to 14 days per year. Nationwide analysis of diurnal variation in the pollutants and the use of airmass back trajectory clustering and statistical modelling for three locations – Reading, Sheffield and Glasgow – suggests that local traffic plays a dominant role in NO<small><sub>2</sub></small> pollution, PM<small><sub>2<em>.</em>5</sub></small> is influenced more by long range transport and O<small><sub>3</sub></small> increases are being driven in part by decreases in NO<small><sub>2</sub></small>. From an AQ policy perspective, this suggests continued focus on traffic emissions will reduce NO<small><sub>2</sub></small>, (inter)national rather than local efforts are most critical for PM<small><sub>2<em>.</em>5</sub></small> improvements, and reductions to VOC emissions must accompany NO<small><sub>2</sub></small> if further O<small><sub>3</sub></small> increases are to be avoided.</p>\",\"PeriodicalId\":72942,\"journal\":{\"name\":\"Environmental science: atmospheres\",\"volume\":\" 9\",\"pages\":\" 987-997\"},\"PeriodicalIF\":3.5000,\"publicationDate\":\"2025-07-15\",\"publicationTypes\":\"Journal Article\",\"fieldsOfStudy\":null,\"isOpenAccess\":false,\"openAccessPdf\":\"https://pubs.rsc.org/en/content/articlepdf/2025/ea/d5ea00055f?page=search\",\"citationCount\":\"0\",\"resultStr\":null,\"platform\":\"Semanticscholar\",\"paperid\":null,\"PeriodicalName\":\"Environmental science: atmospheres\",\"FirstCategoryId\":\"1085\",\"ListUrlMain\":\"https://pubs.rsc.org/en/content/articlelanding/2025/ea/d5ea00055f\",\"RegionNum\":0,\"RegionCategory\":null,\"ArticlePicture\":[],\"TitleCN\":null,\"AbstractTextCN\":null,\"PMCID\":null,\"EPubDate\":\"\",\"PubModel\":\"\",\"JCR\":\"Q3\",\"JCRName\":\"ENVIRONMENTAL SCIENCES\",\"Score\":null,\"Total\":0}","platform":"Semanticscholar","paperid":null,"PeriodicalName":"Environmental science: atmospheres","FirstCategoryId":"1085","ListUrlMain":"https://pubs.rsc.org/en/content/articlelanding/2025/ea/d5ea00055f","RegionNum":0,"RegionCategory":null,"ArticlePicture":[],"TitleCN":null,"AbstractTextCN":null,"PMCID":null,"EPubDate":"","PubModel":"","JCR":"Q3","JCRName":"ENVIRONMENTAL SCIENCES","Score":null,"Total":0}
UK air quality showed clear improvement from 2015 to 2024 but breaching of targets remains very common†
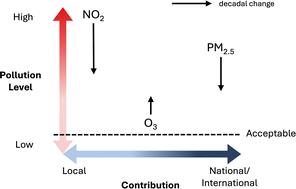
The impact of poor air quality (AQ) on public health has long been recognised and considerable efforts have been made to improve it across the UK. The UK has a far reaching AQ monitoring network and this study summarises the evolution of UK AQ over the period 2015–2024, focusing on the pollutants NO2, O3 and PM2.5 and exploring their drivers. Concentrations of NO2 and PM2.5 exhibit robust negative trends across the whole country while concentrations of O3 increase. Comparing 2015–2016 to 2023–2024, the median number of days per year for which DEFRA AQ sites breached the WHO 2021 target decreased from 136 to 40 (−70%) for NO2 and from 60 to 22 (−63%) for PM2.5. This trend was mirrored in other AQ monitoring networks and highlights that, while progress is being made, acceptable levels of AQ are yet to be reached. Over the same period, median O3 exceedances increased from 7 to 14 days per year. Nationwide analysis of diurnal variation in the pollutants and the use of airmass back trajectory clustering and statistical modelling for three locations – Reading, Sheffield and Glasgow – suggests that local traffic plays a dominant role in NO2 pollution, PM2.5 is influenced more by long range transport and O3 increases are being driven in part by decreases in NO2. From an AQ policy perspective, this suggests continued focus on traffic emissions will reduce NO2, (inter)national rather than local efforts are most critical for PM2.5 improvements, and reductions to VOC emissions must accompany NO2 if further O3 increases are to be avoided.

 求助内容:
求助内容: 应助结果提醒方式:


