{"title":"Dotplotic:用于BLAST +比对和基因组注释的轻量级可视化工具。","authors":"Hideyuki Miyazawa, Toshiyuki Oda","doi":"10.1186/s12859-025-06255-5","DOIUrl":null,"url":null,"abstract":"<p><p>With the development of sequencing technologies, chromosome-level genome assemblies have become increasingly common across various organisms, including non-model species. BLAST + is one of the most widely used bioinformatics tools for computing sequence alignments, offering numerous optimizations for speed and scalability. Dot plots, which visualize the similarity between two sequences, are widely used in biological research. However, while many dot plot-generating programs exist, most rely on their own alignment algorithms, and it is uncommon to visualize external BLAST results directly. Here, we present Dotplotic, a lightweight Perl program that generates dot plot-like visualizations based on BLAST output in tabular format. Dotplotic visualizes each alignment as a line connecting the start and end points of the query and subject sequences, with a gradient color indicating sequence identity. It allows users to overlay annotation data from external files onto the plot. Although command-line-based, Dotplotic is implemented as a single script using only core Perl modules, making it easy to install and run across platforms. The program supports standard input for both BLAST results and annotation files, enabling flexible visualization under various conditions, such as filtering specific alignments or displaying selected genomic features like genes or repeats. Dotplotic is an efficient, portable, and easy-to-use visualization tool that enhances the exploration of sequence alignments and serves as a valuable resource for both bioinformatics and broader biological research.</p>","PeriodicalId":8958,"journal":{"name":"BMC Bioinformatics","volume":"26 1","pages":"222"},"PeriodicalIF":3.3000,"publicationDate":"2025-08-27","publicationTypes":"Journal Article","fieldsOfStudy":null,"isOpenAccess":false,"openAccessPdf":"https://www.ncbi.nlm.nih.gov/pmc/articles/PMC12392551/pdf/","citationCount":"0","resultStr":"{\"title\":\"Dotplotic: a lightweight visualization tool for BLAST + alignments and genomic annotations.\",\"authors\":\"Hideyuki Miyazawa, Toshiyuki Oda\",\"doi\":\"10.1186/s12859-025-06255-5\",\"DOIUrl\":null,\"url\":null,\"abstract\":\"<p><p>With the development of sequencing technologies, chromosome-level genome assemblies have become increasingly common across various organisms, including non-model species. BLAST + is one of the most widely used bioinformatics tools for computing sequence alignments, offering numerous optimizations for speed and scalability. Dot plots, which visualize the similarity between two sequences, are widely used in biological research. However, while many dot plot-generating programs exist, most rely on their own alignment algorithms, and it is uncommon to visualize external BLAST results directly. Here, we present Dotplotic, a lightweight Perl program that generates dot plot-like visualizations based on BLAST output in tabular format. Dotplotic visualizes each alignment as a line connecting the start and end points of the query and subject sequences, with a gradient color indicating sequence identity. It allows users to overlay annotation data from external files onto the plot. Although command-line-based, Dotplotic is implemented as a single script using only core Perl modules, making it easy to install and run across platforms. The program supports standard input for both BLAST results and annotation files, enabling flexible visualization under various conditions, such as filtering specific alignments or displaying selected genomic features like genes or repeats. Dotplotic is an efficient, portable, and easy-to-use visualization tool that enhances the exploration of sequence alignments and serves as a valuable resource for both bioinformatics and broader biological research.</p>\",\"PeriodicalId\":8958,\"journal\":{\"name\":\"BMC Bioinformatics\",\"volume\":\"26 1\",\"pages\":\"222\"},\"PeriodicalIF\":3.3000,\"publicationDate\":\"2025-08-27\",\"publicationTypes\":\"Journal Article\",\"fieldsOfStudy\":null,\"isOpenAccess\":false,\"openAccessPdf\":\"https://www.ncbi.nlm.nih.gov/pmc/articles/PMC12392551/pdf/\",\"citationCount\":\"0\",\"resultStr\":null,\"platform\":\"Semanticscholar\",\"paperid\":null,\"PeriodicalName\":\"BMC Bioinformatics\",\"FirstCategoryId\":\"99\",\"ListUrlMain\":\"https://doi.org/10.1186/s12859-025-06255-5\",\"RegionNum\":3,\"RegionCategory\":\"生物学\",\"ArticlePicture\":[],\"TitleCN\":null,\"AbstractTextCN\":null,\"PMCID\":null,\"EPubDate\":\"\",\"PubModel\":\"\",\"JCR\":\"Q2\",\"JCRName\":\"BIOCHEMICAL RESEARCH METHODS\",\"Score\":null,\"Total\":0}","platform":"Semanticscholar","paperid":null,"PeriodicalName":"BMC Bioinformatics","FirstCategoryId":"99","ListUrlMain":"https://doi.org/10.1186/s12859-025-06255-5","RegionNum":3,"RegionCategory":"生物学","ArticlePicture":[],"TitleCN":null,"AbstractTextCN":null,"PMCID":null,"EPubDate":"","PubModel":"","JCR":"Q2","JCRName":"BIOCHEMICAL RESEARCH METHODS","Score":null,"Total":0}
Dotplotic: a lightweight visualization tool for BLAST + alignments and genomic annotations.
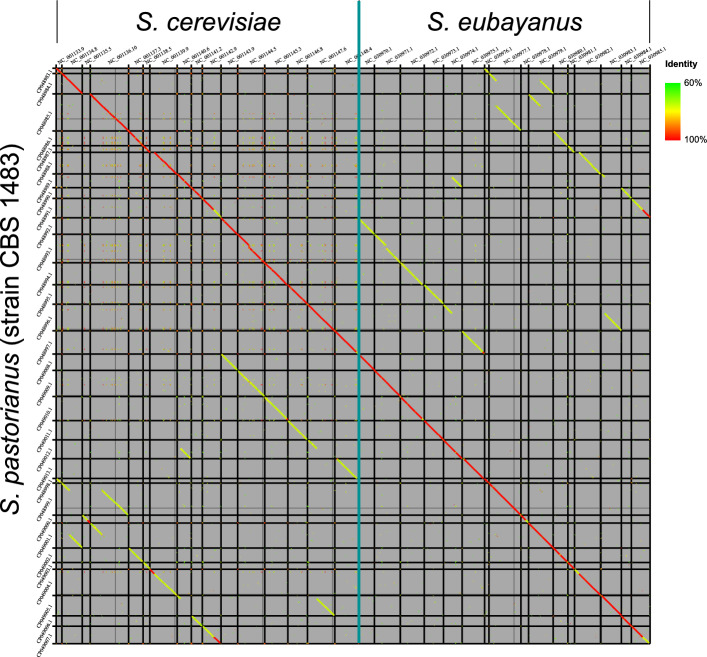
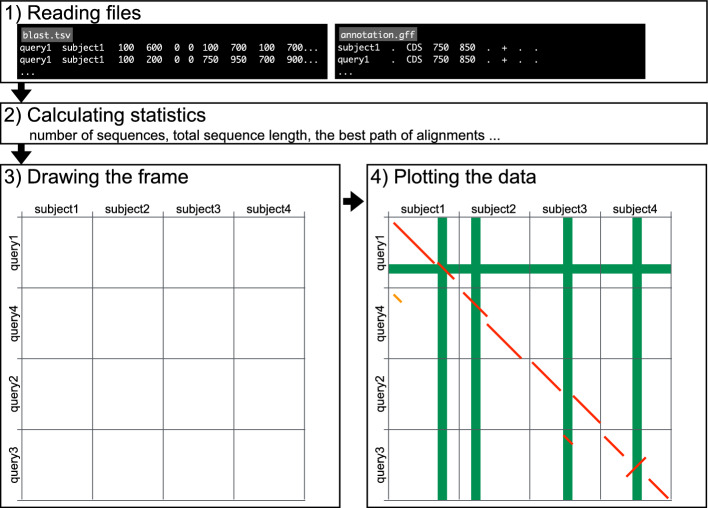
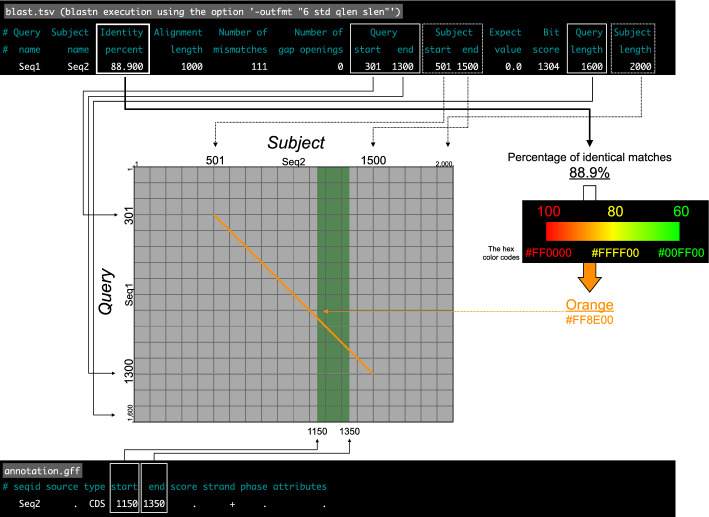
With the development of sequencing technologies, chromosome-level genome assemblies have become increasingly common across various organisms, including non-model species. BLAST + is one of the most widely used bioinformatics tools for computing sequence alignments, offering numerous optimizations for speed and scalability. Dot plots, which visualize the similarity between two sequences, are widely used in biological research. However, while many dot plot-generating programs exist, most rely on their own alignment algorithms, and it is uncommon to visualize external BLAST results directly. Here, we present Dotplotic, a lightweight Perl program that generates dot plot-like visualizations based on BLAST output in tabular format. Dotplotic visualizes each alignment as a line connecting the start and end points of the query and subject sequences, with a gradient color indicating sequence identity. It allows users to overlay annotation data from external files onto the plot. Although command-line-based, Dotplotic is implemented as a single script using only core Perl modules, making it easy to install and run across platforms. The program supports standard input for both BLAST results and annotation files, enabling flexible visualization under various conditions, such as filtering specific alignments or displaying selected genomic features like genes or repeats. Dotplotic is an efficient, portable, and easy-to-use visualization tool that enhances the exploration of sequence alignments and serves as a valuable resource for both bioinformatics and broader biological research.
期刊介绍:
BMC Bioinformatics is an open access, peer-reviewed journal that considers articles on all aspects of the development, testing and novel application of computational and statistical methods for the modeling and analysis of all kinds of biological data, as well as other areas of computational biology.
BMC Bioinformatics is part of the BMC series which publishes subject-specific journals focused on the needs of individual research communities across all areas of biology and medicine. We offer an efficient, fair and friendly peer review service, and are committed to publishing all sound science, provided that there is some advance in knowledge presented by the work.
 求助内容:
求助内容: 应助结果提醒方式:


