地球上最大的红树林植物多样性遥感制图:利用DESIS高光谱数据和“光谱物种”概念开发光谱多样性度量

IF 4.5 Q2 ENVIRONMENTAL SCIENCES
Subham Banerjee , Swapan Kumar Sarker , Bryan Pijanowski
{"title":"地球上最大的红树林植物多样性遥感制图:利用DESIS高光谱数据和“光谱物种”概念开发光谱多样性度量","authors":"Subham Banerjee ,&nbsp;Swapan Kumar Sarker ,&nbsp;Bryan Pijanowski","doi":"10.1016/j.rsase.2025.101676","DOIUrl":null,"url":null,"abstract":"<div><div>Global biodiversity monitoring faces significant challenges, yet recent advancements in spaceborne remote sensing, particularly through hyperspectral sensors, are opening new avenues for cost-effective and scalable plant diversity mapping. The high spectral resolution of these sensors enables precise identification of plant traits and community compositions. Employing the “Spectral Species” concept, which categorizes spectral imagery pixels into distinct spectral types, we have developed a novel semi-discrete “Spectral Species Diversity” (SSD) metric. This metric has proven effective in modeling plant diversity, as demonstrated by our study in the mangrove forests of Bangladesh's Sundarbans using DESIS (DLR Earth Sensing Imaging Spectrometer) hyperspectral imagery.</div><div>In this study, we analyzed data from 110 Permanent Sampling Plots in the Sundarbans, calculated traditional plant diversity indices (Species Richness, Shannon and Simpson Diversity), and compared these with our spectral diversity metric. The comparison revealed robust correlations between field-measured plant diversity and our DESIS-derived SSD (<em>R</em><sup><em>2</em></sup> = 0.473 for Shannon diversity and <em>R</em><sup><em>2</em></sup> = 0.468 for Simpson diversity). However, species richness showed poor correlation with the newly developed SSD metric. Conversely, the continuous conventional Coefficient of Variation (CV) spectral diversity metric, also computed using the same hyperspectral dataset, underperformed relative to the SSD metric. Furthermore, when assessing the performance of our SSD metric using multispectral imagery from Sentinel-2 and Landsat 8, the metrics derived from Sentinel-2 exhibited weaker relationships with plant diversity (<em>R</em><sup><em>2</em></sup> = 0.152 for Shannon Diversity and <em>R</em><sup><em>2</em></sup> = 0.144 for Simpson Diversity), and those from Landsat 8 were less effective.</div><div>Upon examining different spectral space sizes, we determined that the optimal size for computing spectral diversity metrics was 150 m × 150 m. This size most effectively captured plant diversity in the vegetation survey plots. While the SSD metric within these spectral spaces mirrored the plant diversity trend across the three salinity zones of the Sundarbans, the observed differences were not statistically significant. Nonetheless, the alignment in pattern highlights the ecological relevance of the SSD metric.</div><div>This study underscores that the newly developed SSD metric, utilizing hyperspectral imaging and adapting the Spectral Species concept, can accurately map plant diversity in ecologically diverse ecosystems like the Sundarbans mangroves. Future enhancements, such as aligning spectral space with vegetation survey plot dimensions and incorporating data from SWIR sensors, SAR, or LiDAR, could further refine the metric's robustness and global applicability. These improvements will provide crucial insights for biodiversity conservation and ecological research through precise plant diversity and distribution mapping.</div></div>","PeriodicalId":53227,"journal":{"name":"Remote Sensing Applications-Society and Environment","volume":"39 ","pages":"Article 101676"},"PeriodicalIF":4.5000,"publicationDate":"2025-08-01","publicationTypes":"Journal Article","fieldsOfStudy":null,"isOpenAccess":false,"openAccessPdf":"","citationCount":"0","resultStr":"{\"title\":\"Remotely sensed mapping of plant diversity in Earth's largest mangrove forests: Developing a spectral diversity metric with DESIS hyperspectral data and the ‘spectral species’ concept\",\"authors\":\"Subham Banerjee ,&nbsp;Swapan Kumar Sarker ,&nbsp;Bryan Pijanowski\",\"doi\":\"10.1016/j.rsase.2025.101676\",\"DOIUrl\":null,\"url\":null,\"abstract\":\"<div><div>Global biodiversity monitoring faces significant challenges, yet recent advancements in spaceborne remote sensing, particularly through hyperspectral sensors, are opening new avenues for cost-effective and scalable plant diversity mapping. The high spectral resolution of these sensors enables precise identification of plant traits and community compositions. Employing the “Spectral Species” concept, which categorizes spectral imagery pixels into distinct spectral types, we have developed a novel semi-discrete “Spectral Species Diversity” (SSD) metric. This metric has proven effective in modeling plant diversity, as demonstrated by our study in the mangrove forests of Bangladesh's Sundarbans using DESIS (DLR Earth Sensing Imaging Spectrometer) hyperspectral imagery.</div><div>In this study, we analyzed data from 110 Permanent Sampling Plots in the Sundarbans, calculated traditional plant diversity indices (Species Richness, Shannon and Simpson Diversity), and compared these with our spectral diversity metric. The comparison revealed robust correlations between field-measured plant diversity and our DESIS-derived SSD (<em>R</em><sup><em>2</em></sup> = 0.473 for Shannon diversity and <em>R</em><sup><em>2</em></sup> = 0.468 for Simpson diversity). However, species richness showed poor correlation with the newly developed SSD metric. Conversely, the continuous conventional Coefficient of Variation (CV) spectral diversity metric, also computed using the same hyperspectral dataset, underperformed relative to the SSD metric. Furthermore, when assessing the performance of our SSD metric using multispectral imagery from Sentinel-2 and Landsat 8, the metrics derived from Sentinel-2 exhibited weaker relationships with plant diversity (<em>R</em><sup><em>2</em></sup> = 0.152 for Shannon Diversity and <em>R</em><sup><em>2</em></sup> = 0.144 for Simpson Diversity), and those from Landsat 8 were less effective.</div><div>Upon examining different spectral space sizes, we determined that the optimal size for computing spectral diversity metrics was 150 m × 150 m. This size most effectively captured plant diversity in the vegetation survey plots. While the SSD metric within these spectral spaces mirrored the plant diversity trend across the three salinity zones of the Sundarbans, the observed differences were not statistically significant. Nonetheless, the alignment in pattern highlights the ecological relevance of the SSD metric.</div><div>This study underscores that the newly developed SSD metric, utilizing hyperspectral imaging and adapting the Spectral Species concept, can accurately map plant diversity in ecologically diverse ecosystems like the Sundarbans mangroves. Future enhancements, such as aligning spectral space with vegetation survey plot dimensions and incorporating data from SWIR sensors, SAR, or LiDAR, could further refine the metric's robustness and global applicability. These improvements will provide crucial insights for biodiversity conservation and ecological research through precise plant diversity and distribution mapping.</div></div>\",\"PeriodicalId\":53227,\"journal\":{\"name\":\"Remote Sensing Applications-Society and Environment\",\"volume\":\"39 \",\"pages\":\"Article 101676\"},\"PeriodicalIF\":4.5000,\"publicationDate\":\"2025-08-01\",\"publicationTypes\":\"Journal Article\",\"fieldsOfStudy\":null,\"isOpenAccess\":false,\"openAccessPdf\":\"\",\"citationCount\":\"0\",\"resultStr\":null,\"platform\":\"Semanticscholar\",\"paperid\":null,\"PeriodicalName\":\"Remote Sensing Applications-Society and Environment\",\"FirstCategoryId\":\"1085\",\"ListUrlMain\":\"https://www.sciencedirect.com/science/article/pii/S2352938525002290\",\"RegionNum\":0,\"RegionCategory\":null,\"ArticlePicture\":[],\"TitleCN\":null,\"AbstractTextCN\":null,\"PMCID\":null,\"EPubDate\":\"\",\"PubModel\":\"\",\"JCR\":\"Q2\",\"JCRName\":\"ENVIRONMENTAL SCIENCES\",\"Score\":null,\"Total\":0}","platform":"Semanticscholar","paperid":null,"PeriodicalName":"Remote Sensing Applications-Society and Environment","FirstCategoryId":"1085","ListUrlMain":"https://www.sciencedirect.com/science/article/pii/S2352938525002290","RegionNum":0,"RegionCategory":null,"ArticlePicture":[],"TitleCN":null,"AbstractTextCN":null,"PMCID":null,"EPubDate":"","PubModel":"","JCR":"Q2","JCRName":"ENVIRONMENTAL SCIENCES","Score":null,"Total":0}
引用次数: 0

摘要

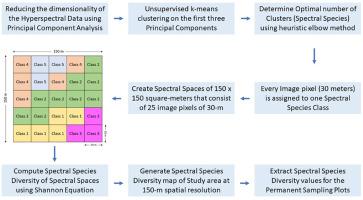
全球生物多样性监测面临重大挑战,但星载遥感的最新进展,特别是通过高光谱传感器取得的进展,正在为具有成本效益和可扩展的植物多样性制图开辟新的途径。这些传感器的高光谱分辨率使其能够精确识别植物性状和群落组成。采用“光谱物种”概念,将光谱图像像素分类为不同的光谱类型,我们开发了一种新颖的半离散“光谱物种多样性”(SSD)度量。我们利用DLR地球传感成像光谱仪(DESIS)高光谱图像对孟加拉国孙德尔本斯的红树林进行了研究,结果证明,该指标在模拟植物多样性方面是有效的。本文分析了孙德尔本斯地区110个永久样地的数据,计算了传统的植物多样性指数(物种丰富度、Shannon多样性和Simpson多样性),并将其与光谱多样性指标进行了比较。田间测量的植物多样性与我们的desis衍生的SSD之间存在显著相关性(Shannon多样性R2 = 0.473, Simpson多样性R2 = 0.468)。然而,物种丰富度与新开发的SSD指标相关性较差。相反,同样使用相同的高光谱数据集计算的连续传统变异系数(CV)光谱多样性指标,相对于SSD指标表现不佳。此外,当使用来自Sentinel-2和Landsat 8的多光谱图像评估我们的SSD指标的性能时,来自Sentinel-2的指标与植物多样性的关系较弱(香农多样性R2 = 0.152,辛普森多样性R2 = 0.144),而来自Landsat 8的指标效果较差。通过研究不同的光谱空间尺寸,我们确定了计算光谱多样性指标的最佳尺寸为150 m × 150 m。这个尺寸最有效地捕获了植被调查样地的植物多样性。虽然光谱空间内的SSD指标反映了孙德尔本斯三个盐度带的植物多样性趋势,但观察到的差异没有统计学意义。尽管如此,模式的一致性突出了SSD度量的生态相关性。本研究表明,利用高光谱成像和光谱物种概念,新开发的SSD指标可以准确地绘制孙德尔本斯红树林等生态多样性生态系统中的植物多样性。未来的增强功能,如将光谱空间与植被调查地块尺寸相匹配,并结合来自SWIR传感器、SAR或LiDAR的数据,可以进一步完善度量的鲁棒性和全球适用性。这些改进将通过精确的植物多样性和分布制图为生物多样性保护和生态学研究提供重要的见解。
本文章由计算机程序翻译,如有差异,请以英文原文为准。

Remotely sensed mapping of plant diversity in Earth's largest mangrove forests: Developing a spectral diversity metric with DESIS hyperspectral data and the ‘spectral species’ concept

Remotely sensed mapping of plant diversity in Earth's largest mangrove forests: Developing a spectral diversity metric with DESIS hyperspectral data and the ‘spectral species’ concept
Global biodiversity monitoring faces significant challenges, yet recent advancements in spaceborne remote sensing, particularly through hyperspectral sensors, are opening new avenues for cost-effective and scalable plant diversity mapping. The high spectral resolution of these sensors enables precise identification of plant traits and community compositions. Employing the “Spectral Species” concept, which categorizes spectral imagery pixels into distinct spectral types, we have developed a novel semi-discrete “Spectral Species Diversity” (SSD) metric. This metric has proven effective in modeling plant diversity, as demonstrated by our study in the mangrove forests of Bangladesh's Sundarbans using DESIS (DLR Earth Sensing Imaging Spectrometer) hyperspectral imagery.
In this study, we analyzed data from 110 Permanent Sampling Plots in the Sundarbans, calculated traditional plant diversity indices (Species Richness, Shannon and Simpson Diversity), and compared these with our spectral diversity metric. The comparison revealed robust correlations between field-measured plant diversity and our DESIS-derived SSD (R2 = 0.473 for Shannon diversity and R2 = 0.468 for Simpson diversity). However, species richness showed poor correlation with the newly developed SSD metric. Conversely, the continuous conventional Coefficient of Variation (CV) spectral diversity metric, also computed using the same hyperspectral dataset, underperformed relative to the SSD metric. Furthermore, when assessing the performance of our SSD metric using multispectral imagery from Sentinel-2 and Landsat 8, the metrics derived from Sentinel-2 exhibited weaker relationships with plant diversity (R2 = 0.152 for Shannon Diversity and R2 = 0.144 for Simpson Diversity), and those from Landsat 8 were less effective.
Upon examining different spectral space sizes, we determined that the optimal size for computing spectral diversity metrics was 150 m × 150 m. This size most effectively captured plant diversity in the vegetation survey plots. While the SSD metric within these spectral spaces mirrored the plant diversity trend across the three salinity zones of the Sundarbans, the observed differences were not statistically significant. Nonetheless, the alignment in pattern highlights the ecological relevance of the SSD metric.
This study underscores that the newly developed SSD metric, utilizing hyperspectral imaging and adapting the Spectral Species concept, can accurately map plant diversity in ecologically diverse ecosystems like the Sundarbans mangroves. Future enhancements, such as aligning spectral space with vegetation survey plot dimensions and incorporating data from SWIR sensors, SAR, or LiDAR, could further refine the metric's robustness and global applicability. These improvements will provide crucial insights for biodiversity conservation and ecological research through precise plant diversity and distribution mapping.
求助全文
通过发布文献求助,成功后即可免费获取论文全文。 去求助
来源期刊
CiteScore
8.00
自引率
8.50%
发文量
204
审稿时长
65 days
期刊介绍: The journal ''Remote Sensing Applications: Society and Environment'' (RSASE) focuses on remote sensing studies that address specific topics with an emphasis on environmental and societal issues - regional / local studies with global significance. Subjects are encouraged to have an interdisciplinary approach and include, but are not limited by: " -Global and climate change studies addressing the impact of increasing concentrations of greenhouse gases, CO2 emission, carbon balance and carbon mitigation, energy system on social and environmental systems -Ecological and environmental issues including biodiversity, ecosystem dynamics, land degradation, atmospheric and water pollution, urban footprint, ecosystem management and natural hazards (e.g. earthquakes, typhoons, floods, landslides) -Natural resource studies including land-use in general, biomass estimation, forests, agricultural land, plantation, soils, coral reefs, wetland and water resources -Agriculture, food production systems and food security outcomes -Socio-economic issues including urban systems, urban growth, public health, epidemics, land-use transition and land use conflicts -Oceanography and coastal zone studies, including sea level rise projections, coastlines changes and the ocean-land interface -Regional challenges for remote sensing application techniques, monitoring and analysis, such as cloud screening and atmospheric correction for tropical regions -Interdisciplinary studies combining remote sensing, household survey data, field measurements and models to address environmental, societal and sustainability issues -Quantitative and qualitative analysis that documents the impact of using remote sensing studies in social, political, environmental or economic systems
×
引用
GB/T 7714-2015
复制
MLA
复制
APA
复制
导出至
BibTeX EndNote RefMan NoteFirst NoteExpress
×
提示
您的信息不完整,为了账户安全,请先补充。
现在去补充
×
提示
您因"违规操作"
具体请查看互助需知
我知道了
×
提示
确定
请完成安全验证×
copy
已复制链接
快去分享给好友吧!
我知道了
右上角分享
点击右上角分享
0
联系我们:info@booksci.cn Book学术提供免费学术资源搜索服务,方便国内外学者检索中英文文献。致力于提供最便捷和优质的服务体验。 Copyright © 2023 布克学术 All rights reserved.
京ICP备2023020795号-1
ghs 京公网安备 11010802042870号
Book学术文献互助
Book学术文献互助群
群 号:604180095
Book学术官方微信