{"title":"棱镜:多维混合模型的探索","authors":"B. Zahoransky, T. Günther, K. Lawonn","doi":"10.1111/cgf.70121","DOIUrl":null,"url":null,"abstract":"<div>\n \n <p>In data science, visual data exploration becomes increasingly more challenging due to the continued rapid increase of data dimensionality and data sizes. To manage complexity, two orthogonal approaches are commonly used in practice: First, data is frequently clustered in high-dimensional space by fitting mixture models composed of normal distributions or Student t-distributions. Second, dimensionality reduction is employed to embed high-dimensional point clouds in a two- or three-dimensional space. Those algorithms determine the spatial arrangement in low-dimensional space without further user interaction. This leaves little room for a guided exploration and data analysis. In this paper, we propose a novel visualization system for the effective exploration and construction of potential subspaces onto which mixture models can be projected. The subspaces are spanned linearly via basis vectors, for which a vast number of basis vector combinations is theoretically imaginable. Our system guides the user step-by-step through the selection process by letting users choose one basis vector at a time. To guide the process, multiple choices are pre-visualized at once on a multi-faceted prism. In addition to the qualitative visualization of the distributions, multiple quantitative metrics are calculated by which subspaces can be compared and reordered, including variance, sparsity, and visibility. Further, a bookmarking tool lets users record and compare different basis vector combinations. The usability of the system is evaluated by data scientists and is tested on several high-dimensional data sets.</p>\n </div>","PeriodicalId":10687,"journal":{"name":"Computer Graphics Forum","volume":"44 3","pages":""},"PeriodicalIF":2.9000,"publicationDate":"2025-05-23","publicationTypes":"Journal Article","fieldsOfStudy":null,"isOpenAccess":false,"openAccessPdf":"https://onlinelibrary.wiley.com/doi/epdf/10.1111/cgf.70121","citationCount":"0","resultStr":"{\"title\":\"PrismBreak: Exploration of Multi-Dimensional Mixture Models\",\"authors\":\"B. Zahoransky, T. Günther, K. Lawonn\",\"doi\":\"10.1111/cgf.70121\",\"DOIUrl\":null,\"url\":null,\"abstract\":\"<div>\\n \\n <p>In data science, visual data exploration becomes increasingly more challenging due to the continued rapid increase of data dimensionality and data sizes. To manage complexity, two orthogonal approaches are commonly used in practice: First, data is frequently clustered in high-dimensional space by fitting mixture models composed of normal distributions or Student t-distributions. Second, dimensionality reduction is employed to embed high-dimensional point clouds in a two- or three-dimensional space. Those algorithms determine the spatial arrangement in low-dimensional space without further user interaction. This leaves little room for a guided exploration and data analysis. In this paper, we propose a novel visualization system for the effective exploration and construction of potential subspaces onto which mixture models can be projected. The subspaces are spanned linearly via basis vectors, for which a vast number of basis vector combinations is theoretically imaginable. Our system guides the user step-by-step through the selection process by letting users choose one basis vector at a time. To guide the process, multiple choices are pre-visualized at once on a multi-faceted prism. In addition to the qualitative visualization of the distributions, multiple quantitative metrics are calculated by which subspaces can be compared and reordered, including variance, sparsity, and visibility. Further, a bookmarking tool lets users record and compare different basis vector combinations. The usability of the system is evaluated by data scientists and is tested on several high-dimensional data sets.</p>\\n </div>\",\"PeriodicalId\":10687,\"journal\":{\"name\":\"Computer Graphics Forum\",\"volume\":\"44 3\",\"pages\":\"\"},\"PeriodicalIF\":2.9000,\"publicationDate\":\"2025-05-23\",\"publicationTypes\":\"Journal Article\",\"fieldsOfStudy\":null,\"isOpenAccess\":false,\"openAccessPdf\":\"https://onlinelibrary.wiley.com/doi/epdf/10.1111/cgf.70121\",\"citationCount\":\"0\",\"resultStr\":null,\"platform\":\"Semanticscholar\",\"paperid\":null,\"PeriodicalName\":\"Computer Graphics Forum\",\"FirstCategoryId\":\"94\",\"ListUrlMain\":\"https://onlinelibrary.wiley.com/doi/10.1111/cgf.70121\",\"RegionNum\":4,\"RegionCategory\":\"计算机科学\",\"ArticlePicture\":[],\"TitleCN\":null,\"AbstractTextCN\":null,\"PMCID\":null,\"EPubDate\":\"\",\"PubModel\":\"\",\"JCR\":\"Q2\",\"JCRName\":\"COMPUTER SCIENCE, SOFTWARE ENGINEERING\",\"Score\":null,\"Total\":0}","platform":"Semanticscholar","paperid":null,"PeriodicalName":"Computer Graphics Forum","FirstCategoryId":"94","ListUrlMain":"https://onlinelibrary.wiley.com/doi/10.1111/cgf.70121","RegionNum":4,"RegionCategory":"计算机科学","ArticlePicture":[],"TitleCN":null,"AbstractTextCN":null,"PMCID":null,"EPubDate":"","PubModel":"","JCR":"Q2","JCRName":"COMPUTER SCIENCE, SOFTWARE ENGINEERING","Score":null,"Total":0}
PrismBreak: Exploration of Multi-Dimensional Mixture Models
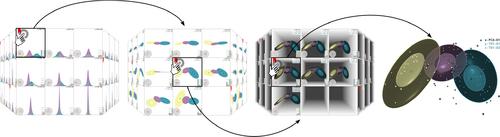
In data science, visual data exploration becomes increasingly more challenging due to the continued rapid increase of data dimensionality and data sizes. To manage complexity, two orthogonal approaches are commonly used in practice: First, data is frequently clustered in high-dimensional space by fitting mixture models composed of normal distributions or Student t-distributions. Second, dimensionality reduction is employed to embed high-dimensional point clouds in a two- or three-dimensional space. Those algorithms determine the spatial arrangement in low-dimensional space without further user interaction. This leaves little room for a guided exploration and data analysis. In this paper, we propose a novel visualization system for the effective exploration and construction of potential subspaces onto which mixture models can be projected. The subspaces are spanned linearly via basis vectors, for which a vast number of basis vector combinations is theoretically imaginable. Our system guides the user step-by-step through the selection process by letting users choose one basis vector at a time. To guide the process, multiple choices are pre-visualized at once on a multi-faceted prism. In addition to the qualitative visualization of the distributions, multiple quantitative metrics are calculated by which subspaces can be compared and reordered, including variance, sparsity, and visibility. Further, a bookmarking tool lets users record and compare different basis vector combinations. The usability of the system is evaluated by data scientists and is tested on several high-dimensional data sets.
期刊介绍:
Computer Graphics Forum is the official journal of Eurographics, published in cooperation with Wiley-Blackwell, and is a unique, international source of information for computer graphics professionals interested in graphics developments worldwide. It is now one of the leading journals for researchers, developers and users of computer graphics in both commercial and academic environments. The journal reports on the latest developments in the field throughout the world and covers all aspects of the theory, practice and application of computer graphics.
 求助内容:
求助内容: 应助结果提醒方式:


