Michal Yackobovitch-Gavan, Moshe Phillip, Shlomit Shalitin
{"title":"世卫组织和疾病预防控制中心用于确定以色列年轻人口体重状况的增长图表的比较:一项基于人群的横断面研究。","authors":"Michal Yackobovitch-Gavan, Moshe Phillip, Shlomit Shalitin","doi":"10.1186/s13584-025-00699-z","DOIUrl":null,"url":null,"abstract":"<p><strong>Background: </strong>In Israel, the absence of national growth charts leads to the use of CDC or WHO growth charts to assess pediatric growth indices. This population-based cross-sectional study compared BMI z-scores and weight classifications using CDC and WHO charts in children insured by Clalit Health Services (CHS).</p><p><strong>Methods: </strong>The study analyzed the CHS electronic database for patients aged 2-18 years with at least one recorded BMI measurement from January 2017 to December 2023. Exclusion criteria included improbable BMI measurements (> 60 kg/m<sup>2</sup> or < 10 kg/m<sup>2</sup>). Demographic data, height, and weight were collected, and BMI z-scores were calculated using both CDC and WHO growth charts. Results were stratified by sex and age groups (2-5 years and > 5-18 years).</p><p><strong>Results: </strong>The cohort included 1,475,543 children: 488,008 aged 2-5 years (52% male) and 987,535 aged > 5-18 years (51% male). In the younger group, the median CDC BMI z-scores were below 0 (< 50th percentile), while the median WHO BMI z-scores were above 0 for both sexes, with significant differences between methods (P < 0.001). BMI z-scores were lower in males than in females across both methods (P < 0.001). In the older group, for both methods, the median BMI z-scores were above 0. WHO z-scores had higher medians in males compared to CDC z-scores (P < 0.001), while in females, z-scores were similar between methods (P = 0.210). CDC showed lower median z-scores for males compared to females (P < 0.001), whereas WHO results were comparable between sexes (P = 0.337). There were significant discrepancies in weight classification, particularly in the 2-5 age group. Overweight rates were over 4% higher using CDC charts compared to WHO (P < 0.001), with minimal agreement (Kappa = 0.06 for males, 0.01 for females). In the older group, WHO classified 4% more children as overweight than CDC (P < 0.001), with moderate agreement in males (Kappa = 0.74) and strong agreement in females (Kappa = 0.81).</p><p><strong>Conclusions: </strong>The study underscores the risk of misclassifying childhood overweight and obesity depending on the growth standard used, particularly in younger children. Policymakers should carefully choose appropriate standards and consider developing national growth charts tailored to the local pediatric population, while allocate resources for early interventions addressing both undernutrition and overnutrition.</p>","PeriodicalId":46694,"journal":{"name":"Israel Journal of Health Policy Research","volume":"14 1","pages":"37"},"PeriodicalIF":2.2000,"publicationDate":"2025-06-16","publicationTypes":"Journal Article","fieldsOfStudy":null,"isOpenAccess":false,"openAccessPdf":"https://www.ncbi.nlm.nih.gov/pmc/articles/PMC12168255/pdf/","citationCount":"0","resultStr":"{\"title\":\"Comparison of WHO and CDC growth charts for defining weight status in the young population in Israel: a population-based cross-sectional study.\",\"authors\":\"Michal Yackobovitch-Gavan, Moshe Phillip, Shlomit Shalitin\",\"doi\":\"10.1186/s13584-025-00699-z\",\"DOIUrl\":null,\"url\":null,\"abstract\":\"<p><strong>Background: </strong>In Israel, the absence of national growth charts leads to the use of CDC or WHO growth charts to assess pediatric growth indices. This population-based cross-sectional study compared BMI z-scores and weight classifications using CDC and WHO charts in children insured by Clalit Health Services (CHS).</p><p><strong>Methods: </strong>The study analyzed the CHS electronic database for patients aged 2-18 years with at least one recorded BMI measurement from January 2017 to December 2023. Exclusion criteria included improbable BMI measurements (> 60 kg/m<sup>2</sup> or < 10 kg/m<sup>2</sup>). Demographic data, height, and weight were collected, and BMI z-scores were calculated using both CDC and WHO growth charts. Results were stratified by sex and age groups (2-5 years and > 5-18 years).</p><p><strong>Results: </strong>The cohort included 1,475,543 children: 488,008 aged 2-5 years (52% male) and 987,535 aged > 5-18 years (51% male). In the younger group, the median CDC BMI z-scores were below 0 (< 50th percentile), while the median WHO BMI z-scores were above 0 for both sexes, with significant differences between methods (P < 0.001). BMI z-scores were lower in males than in females across both methods (P < 0.001). In the older group, for both methods, the median BMI z-scores were above 0. WHO z-scores had higher medians in males compared to CDC z-scores (P < 0.001), while in females, z-scores were similar between methods (P = 0.210). CDC showed lower median z-scores for males compared to females (P < 0.001), whereas WHO results were comparable between sexes (P = 0.337). There were significant discrepancies in weight classification, particularly in the 2-5 age group. Overweight rates were over 4% higher using CDC charts compared to WHO (P < 0.001), with minimal agreement (Kappa = 0.06 for males, 0.01 for females). In the older group, WHO classified 4% more children as overweight than CDC (P < 0.001), with moderate agreement in males (Kappa = 0.74) and strong agreement in females (Kappa = 0.81).</p><p><strong>Conclusions: </strong>The study underscores the risk of misclassifying childhood overweight and obesity depending on the growth standard used, particularly in younger children. Policymakers should carefully choose appropriate standards and consider developing national growth charts tailored to the local pediatric population, while allocate resources for early interventions addressing both undernutrition and overnutrition.</p>\",\"PeriodicalId\":46694,\"journal\":{\"name\":\"Israel Journal of Health Policy Research\",\"volume\":\"14 1\",\"pages\":\"37\"},\"PeriodicalIF\":2.2000,\"publicationDate\":\"2025-06-16\",\"publicationTypes\":\"Journal Article\",\"fieldsOfStudy\":null,\"isOpenAccess\":false,\"openAccessPdf\":\"https://www.ncbi.nlm.nih.gov/pmc/articles/PMC12168255/pdf/\",\"citationCount\":\"0\",\"resultStr\":null,\"platform\":\"Semanticscholar\",\"paperid\":null,\"PeriodicalName\":\"Israel Journal of Health Policy Research\",\"FirstCategoryId\":\"3\",\"ListUrlMain\":\"https://doi.org/10.1186/s13584-025-00699-z\",\"RegionNum\":4,\"RegionCategory\":\"医学\",\"ArticlePicture\":[],\"TitleCN\":null,\"AbstractTextCN\":null,\"PMCID\":null,\"EPubDate\":\"\",\"PubModel\":\"\",\"JCR\":\"Q1\",\"JCRName\":\"HEALTH POLICY & SERVICES\",\"Score\":null,\"Total\":0}","platform":"Semanticscholar","paperid":null,"PeriodicalName":"Israel Journal of Health Policy Research","FirstCategoryId":"3","ListUrlMain":"https://doi.org/10.1186/s13584-025-00699-z","RegionNum":4,"RegionCategory":"医学","ArticlePicture":[],"TitleCN":null,"AbstractTextCN":null,"PMCID":null,"EPubDate":"","PubModel":"","JCR":"Q1","JCRName":"HEALTH POLICY & SERVICES","Score":null,"Total":0}
引用次数: 0
摘要
背景:在以色列,由于缺乏国家生长图表,导致使用CDC或WHO的生长图表来评估儿童生长指数。这项以人群为基础的横断面研究比较了Clalit Health Services (CHS)投保儿童的BMI z分数和体重分类,采用CDC和WHO图表。方法:研究分析了2017年1月至2023年12月期间2-18岁至少有一次BMI测量记录的患者的CHS电子数据库。排除标准包括不可能的BMI测量值(bbb60 kg/m2或2)。收集人口统计数据、身高和体重,并使用CDC和WHO的生长图计算BMI z分数。结果按性别和年龄组(2-5岁和5-18岁)分层。结果:该队列包括1,475,543名儿童:2-5岁488,008名(52%男性),5-18岁987,535名(51%男性)。在年轻的一组中,CDC BMI z分数中位数低于0(结论:该研究强调了根据所使用的生长标准错误分类儿童超重和肥胖的风险,特别是在年幼的儿童中。决策者应谨慎选择适当的标准,并考虑制定适合当地儿科人口的国家增长图表,同时分配资源用于解决营养不良和营养过剩的早期干预措施。
Comparison of WHO and CDC growth charts for defining weight status in the young population in Israel: a population-based cross-sectional study.
Background: In Israel, the absence of national growth charts leads to the use of CDC or WHO growth charts to assess pediatric growth indices. This population-based cross-sectional study compared BMI z-scores and weight classifications using CDC and WHO charts in children insured by Clalit Health Services (CHS).
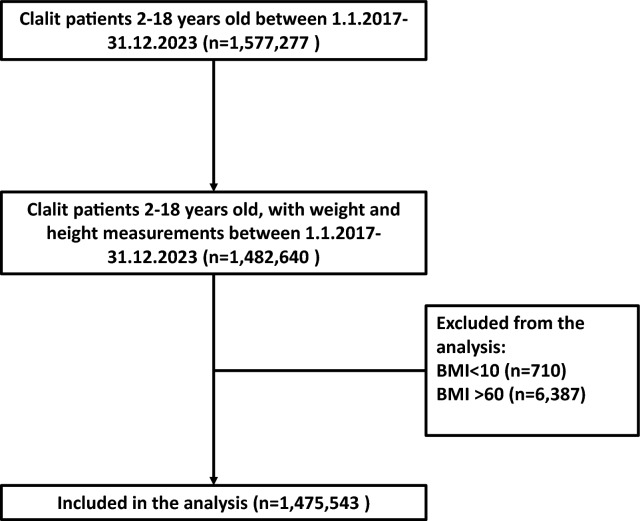
Methods: The study analyzed the CHS electronic database for patients aged 2-18 years with at least one recorded BMI measurement from January 2017 to December 2023. Exclusion criteria included improbable BMI measurements (> 60 kg/m2 or < 10 kg/m2). Demographic data, height, and weight were collected, and BMI z-scores were calculated using both CDC and WHO growth charts. Results were stratified by sex and age groups (2-5 years and > 5-18 years).
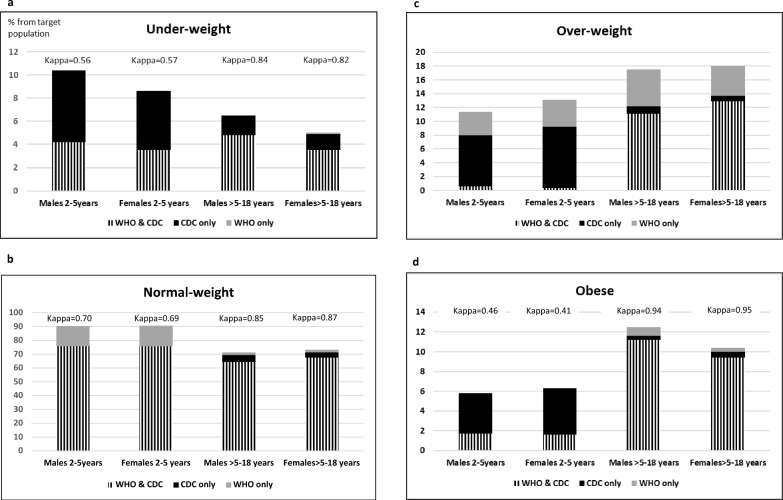
Results: The cohort included 1,475,543 children: 488,008 aged 2-5 years (52% male) and 987,535 aged > 5-18 years (51% male). In the younger group, the median CDC BMI z-scores were below 0 (< 50th percentile), while the median WHO BMI z-scores were above 0 for both sexes, with significant differences between methods (P < 0.001). BMI z-scores were lower in males than in females across both methods (P < 0.001). In the older group, for both methods, the median BMI z-scores were above 0. WHO z-scores had higher medians in males compared to CDC z-scores (P < 0.001), while in females, z-scores were similar between methods (P = 0.210). CDC showed lower median z-scores for males compared to females (P < 0.001), whereas WHO results were comparable between sexes (P = 0.337). There were significant discrepancies in weight classification, particularly in the 2-5 age group. Overweight rates were over 4% higher using CDC charts compared to WHO (P < 0.001), with minimal agreement (Kappa = 0.06 for males, 0.01 for females). In the older group, WHO classified 4% more children as overweight than CDC (P < 0.001), with moderate agreement in males (Kappa = 0.74) and strong agreement in females (Kappa = 0.81).
Conclusions: The study underscores the risk of misclassifying childhood overweight and obesity depending on the growth standard used, particularly in younger children. Policymakers should carefully choose appropriate standards and consider developing national growth charts tailored to the local pediatric population, while allocate resources for early interventions addressing both undernutrition and overnutrition.

 求助内容:
求助内容: 应助结果提醒方式:


