{"title":"应力,应变和机械功率:回复","authors":"Laura A. Buiteman-Kruizinga","doi":"10.1111/anae.16617","DOIUrl":null,"url":null,"abstract":"<p>We thank Fajardo-Campoverdi et al. for their letter [<span>1</span>] and appreciate the insightful comments regarding our study about the effect of rate reduction on the amount of mechanical power [<span>2</span>]. The authors raise an interesting point about the potential influence of the way of flow delivery, whether constant or decelerated, on mechanical power.</p>\n<p>We acknowledge that the method of inspiratory flow delivery can be a relevant factor in energy transfer within the respiratory system. The viscoelastic properties of lung tissue suggest that cyclic deformation, influenced by flow patterns, might contribute to mechanical power and tissue strain. Importantly, energy transfer is not solely determined by peak pressures but also by other parameters and the duration of the respiratory cycle [<span>3</span>]. Although our analysis did not examine the effects of inspiratory flow delivery explicitly, these are, to some extent, captured in the mechanical power equation through peak pressure, which is influenced by flow patterns and resistive pressure components.</p>\n<p>We divided our analysed cohort into patients who received volume-controlled ventilation (n = 920) and those who received pressure-controlled ventilation (n = 812). We then repeated the analysis by creating four subgroups, each for tidal volume and respiratory rate and for peak pressure and respiratory rate. Mechanical power levels were visualised using cumulative distribution graphs for each subgroup. We observed no differences between the two ventilation modes, both in terms of the absolute mechanical power levels and differences in the four subgroups (Fig. 1).</p>\n<figure><picture>\n<source media=\"(min-width: 1650px)\" srcset=\"/cms/asset/5b647d2c-613f-47e6-af22-3502d9e1743b/anae16617-fig-0001-m.jpg\"/><img alt=\"Details are in the caption following the image\" data-lg-src=\"/cms/asset/5b647d2c-613f-47e6-af22-3502d9e1743b/anae16617-fig-0001-m.jpg\" loading=\"lazy\" src=\"/cms/asset/f653d79e-aa47-433f-be14-7fdaae225cac/anae16617-fig-0001-m.png\" title=\"Details are in the caption following the image\"/></picture><figcaption>\n<div><strong>Figure 1<span style=\"font-weight:normal\"></span></strong><div>Open in figure viewer<i aria-hidden=\"true\"></i><span>PowerPoint</span></div>\n</div>\n<div>Cumulative distribution plots of mechanical power in four groups, divided into two ventilation modes. (a) Dark blue, low tidal volume (V<sub>T</sub>) and low respiratory rate; green, high V<sub>T</sub> and low respiratory rate; red, low V<sub>T</sub> and high respiratory rate; light blue, high V<sub>T</sub> and high respiratory rate, in patients who received volume-controlled ventilation. (b) Dark blue, low peak pressure (Ppeak) and low respiratory rate; red, low Ppeak and high respiratory rate; green, high Ppeak and low respiratory rate; light blue, high Ppeak and high respiratory rate, in patients who received volume-controlled ventilation. (c) Dark blue, low tidal volume (V<sub>T</sub>) and low respiratory rate; green, high V<sub>T</sub> and low respiratory rate; red, low V<sub>T</sub> and high respiratory rate; light blue, high V<sub>T</sub> and high respiratory rate, in patients who received pressure-controlled ventilation. (d) Dark blue, low peak pressure (Ppeak) and low respiratory rate; red, low Ppeak and high respiratory rate; green, high Ppeak and low respiratory rate; light blue, high Ppeak and high respiratory rate, in patients who received pressure-controlled ventilation. Vertical dotted lines represent a broadly accepted safety cut-off for mechanical power of 17 J.min<sup>-1</sup> and horizontal dotted lines show the median proportion of patients reaching this cut-off.</div>\n</figcaption>\n</figure>\n<p>We appreciate the critical appraisal by Fajardo-Campoverdi et al. and their suggestion to further explore ventilatory strategies and specific ventilator characteristics in relation to mechanical power. Additional research is needed to gain a deeper understanding of its effects.</p>","PeriodicalId":7742,"journal":{"name":"Anaesthesia","volume":"72 1","pages":""},"PeriodicalIF":7.5000,"publicationDate":"2025-04-20","publicationTypes":"Journal Article","fieldsOfStudy":null,"isOpenAccess":false,"openAccessPdf":"","citationCount":"0","resultStr":"{\"title\":\"Stress, strain and mechanical power: a reply\",\"authors\":\"Laura A. Buiteman-Kruizinga\",\"doi\":\"10.1111/anae.16617\",\"DOIUrl\":null,\"url\":null,\"abstract\":\"<p>We thank Fajardo-Campoverdi et al. for their letter [<span>1</span>] and appreciate the insightful comments regarding our study about the effect of rate reduction on the amount of mechanical power [<span>2</span>]. The authors raise an interesting point about the potential influence of the way of flow delivery, whether constant or decelerated, on mechanical power.</p>\\n<p>We acknowledge that the method of inspiratory flow delivery can be a relevant factor in energy transfer within the respiratory system. The viscoelastic properties of lung tissue suggest that cyclic deformation, influenced by flow patterns, might contribute to mechanical power and tissue strain. Importantly, energy transfer is not solely determined by peak pressures but also by other parameters and the duration of the respiratory cycle [<span>3</span>]. Although our analysis did not examine the effects of inspiratory flow delivery explicitly, these are, to some extent, captured in the mechanical power equation through peak pressure, which is influenced by flow patterns and resistive pressure components.</p>\\n<p>We divided our analysed cohort into patients who received volume-controlled ventilation (n = 920) and those who received pressure-controlled ventilation (n = 812). We then repeated the analysis by creating four subgroups, each for tidal volume and respiratory rate and for peak pressure and respiratory rate. Mechanical power levels were visualised using cumulative distribution graphs for each subgroup. We observed no differences between the two ventilation modes, both in terms of the absolute mechanical power levels and differences in the four subgroups (Fig. 1).</p>\\n<figure><picture>\\n<source media=\\\"(min-width: 1650px)\\\" srcset=\\\"/cms/asset/5b647d2c-613f-47e6-af22-3502d9e1743b/anae16617-fig-0001-m.jpg\\\"/><img alt=\\\"Details are in the caption following the image\\\" data-lg-src=\\\"/cms/asset/5b647d2c-613f-47e6-af22-3502d9e1743b/anae16617-fig-0001-m.jpg\\\" loading=\\\"lazy\\\" src=\\\"/cms/asset/f653d79e-aa47-433f-be14-7fdaae225cac/anae16617-fig-0001-m.png\\\" title=\\\"Details are in the caption following the image\\\"/></picture><figcaption>\\n<div><strong>Figure 1<span style=\\\"font-weight:normal\\\"></span></strong><div>Open in figure viewer<i aria-hidden=\\\"true\\\"></i><span>PowerPoint</span></div>\\n</div>\\n<div>Cumulative distribution plots of mechanical power in four groups, divided into two ventilation modes. (a) Dark blue, low tidal volume (V<sub>T</sub>) and low respiratory rate; green, high V<sub>T</sub> and low respiratory rate; red, low V<sub>T</sub> and high respiratory rate; light blue, high V<sub>T</sub> and high respiratory rate, in patients who received volume-controlled ventilation. (b) Dark blue, low peak pressure (Ppeak) and low respiratory rate; red, low Ppeak and high respiratory rate; green, high Ppeak and low respiratory rate; light blue, high Ppeak and high respiratory rate, in patients who received volume-controlled ventilation. (c) Dark blue, low tidal volume (V<sub>T</sub>) and low respiratory rate; green, high V<sub>T</sub> and low respiratory rate; red, low V<sub>T</sub> and high respiratory rate; light blue, high V<sub>T</sub> and high respiratory rate, in patients who received pressure-controlled ventilation. (d) Dark blue, low peak pressure (Ppeak) and low respiratory rate; red, low Ppeak and high respiratory rate; green, high Ppeak and low respiratory rate; light blue, high Ppeak and high respiratory rate, in patients who received pressure-controlled ventilation. Vertical dotted lines represent a broadly accepted safety cut-off for mechanical power of 17 J.min<sup>-1</sup> and horizontal dotted lines show the median proportion of patients reaching this cut-off.</div>\\n</figcaption>\\n</figure>\\n<p>We appreciate the critical appraisal by Fajardo-Campoverdi et al. and their suggestion to further explore ventilatory strategies and specific ventilator characteristics in relation to mechanical power. Additional research is needed to gain a deeper understanding of its effects.</p>\",\"PeriodicalId\":7742,\"journal\":{\"name\":\"Anaesthesia\",\"volume\":\"72 1\",\"pages\":\"\"},\"PeriodicalIF\":7.5000,\"publicationDate\":\"2025-04-20\",\"publicationTypes\":\"Journal Article\",\"fieldsOfStudy\":null,\"isOpenAccess\":false,\"openAccessPdf\":\"\",\"citationCount\":\"0\",\"resultStr\":null,\"platform\":\"Semanticscholar\",\"paperid\":null,\"PeriodicalName\":\"Anaesthesia\",\"FirstCategoryId\":\"3\",\"ListUrlMain\":\"https://doi.org/10.1111/anae.16617\",\"RegionNum\":1,\"RegionCategory\":\"医学\",\"ArticlePicture\":[],\"TitleCN\":null,\"AbstractTextCN\":null,\"PMCID\":null,\"EPubDate\":\"\",\"PubModel\":\"\",\"JCR\":\"Q1\",\"JCRName\":\"ANESTHESIOLOGY\",\"Score\":null,\"Total\":0}","platform":"Semanticscholar","paperid":null,"PeriodicalName":"Anaesthesia","FirstCategoryId":"3","ListUrlMain":"https://doi.org/10.1111/anae.16617","RegionNum":1,"RegionCategory":"医学","ArticlePicture":[],"TitleCN":null,"AbstractTextCN":null,"PMCID":null,"EPubDate":"","PubModel":"","JCR":"Q1","JCRName":"ANESTHESIOLOGY","Score":null,"Total":0}
We thank Fajardo-Campoverdi et al. for their letter [1] and appreciate the insightful comments regarding our study about the effect of rate reduction on the amount of mechanical power [2]. The authors raise an interesting point about the potential influence of the way of flow delivery, whether constant or decelerated, on mechanical power.
We acknowledge that the method of inspiratory flow delivery can be a relevant factor in energy transfer within the respiratory system. The viscoelastic properties of lung tissue suggest that cyclic deformation, influenced by flow patterns, might contribute to mechanical power and tissue strain. Importantly, energy transfer is not solely determined by peak pressures but also by other parameters and the duration of the respiratory cycle [3]. Although our analysis did not examine the effects of inspiratory flow delivery explicitly, these are, to some extent, captured in the mechanical power equation through peak pressure, which is influenced by flow patterns and resistive pressure components.
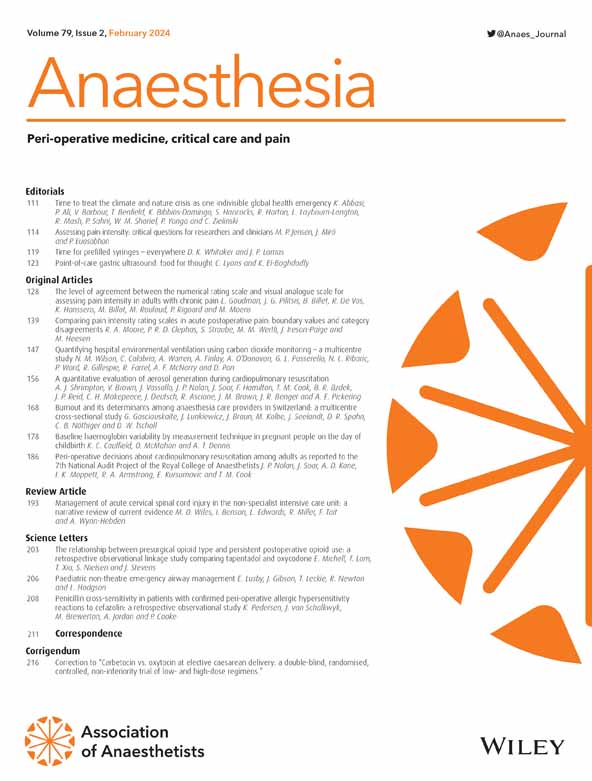
We divided our analysed cohort into patients who received volume-controlled ventilation (n = 920) and those who received pressure-controlled ventilation (n = 812). We then repeated the analysis by creating four subgroups, each for tidal volume and respiratory rate and for peak pressure and respiratory rate. Mechanical power levels were visualised using cumulative distribution graphs for each subgroup. We observed no differences between the two ventilation modes, both in terms of the absolute mechanical power levels and differences in the four subgroups (Fig. 1).
Figure 1
Open in figure viewerPowerPoint
Cumulative distribution plots of mechanical power in four groups, divided into two ventilation modes. (a) Dark blue, low tidal volume (VT) and low respiratory rate; green, high VT and low respiratory rate; red, low VT and high respiratory rate; light blue, high VT and high respiratory rate, in patients who received volume-controlled ventilation. (b) Dark blue, low peak pressure (Ppeak) and low respiratory rate; red, low Ppeak and high respiratory rate; green, high Ppeak and low respiratory rate; light blue, high Ppeak and high respiratory rate, in patients who received volume-controlled ventilation. (c) Dark blue, low tidal volume (VT) and low respiratory rate; green, high VT and low respiratory rate; red, low VT and high respiratory rate; light blue, high VT and high respiratory rate, in patients who received pressure-controlled ventilation. (d) Dark blue, low peak pressure (Ppeak) and low respiratory rate; red, low Ppeak and high respiratory rate; green, high Ppeak and low respiratory rate; light blue, high Ppeak and high respiratory rate, in patients who received pressure-controlled ventilation. Vertical dotted lines represent a broadly accepted safety cut-off for mechanical power of 17 J.min-1 and horizontal dotted lines show the median proportion of patients reaching this cut-off.
We appreciate the critical appraisal by Fajardo-Campoverdi et al. and their suggestion to further explore ventilatory strategies and specific ventilator characteristics in relation to mechanical power. Additional research is needed to gain a deeper understanding of its effects.
期刊介绍:
The official journal of the Association of Anaesthetists is Anaesthesia. It is a comprehensive international publication that covers a wide range of topics. The journal focuses on general and regional anaesthesia, as well as intensive care and pain therapy. It includes original articles that have undergone peer review, covering all aspects of these fields, including research on equipment.

 求助内容:
求助内容: 应助结果提醒方式:


