Xiangjun Gong*, Lin Lian, Xianyu Qi, Jiahui Zhang, Wenjie Du, Juan Li, Jinliang Qiao and Chi Wu,
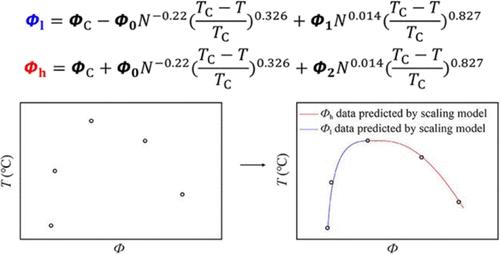
{"title":"大浓度范围内快速绘制聚合物溶液相图的新方法","authors":"Xiangjun Gong*, Lin Lian, Xianyu Qi, Jiahui Zhang, Wenjie Du, Juan Li, Jinliang Qiao and Chi Wu, ","doi":"10.1021/acs.macromol.4c0322310.1021/acs.macromol.4c03223","DOIUrl":null,"url":null,"abstract":"<p >Many industrial applications require a quick method to determine the chain length-dependent phase diagram of a given polymer solution, such as converting a solution polymerization into a precipitation polymerization, to greatly save the cost. However, it is rather difficult and time-consuming to precisely map phase diagrams of polymer solutions with different chain lengths, so that good phase diagrams are scarcely documented in the literature. The difficulties come from two facts: (1) one has to prepare polymer solutions with different concentrations and chain lengths first, and then (2) measure the temperature dependent on each solution carefully, normally taking months if not years. In this study, the chain length and temperature-dependent scaling laws for linear polymer phase diagrams were established as <i></i><math><msub><mi>Φ</mi><mi>l</mi></msub><mo>=</mo><msub><mi>Φ</mi><mi>C</mi></msub><mo>−</mo><msup><msub><mi>Φ</mi><mn>0</mn></msub><mo>*</mo></msup><msup><mi>N</mi><mrow><mo>−</mo><mn>0.22</mn></mrow></msup><msup><mrow><mo>(</mo><mfrac><mrow><msub><mi>T</mi><mi>C</mi></msub><mo>−</mo><mi>T</mi></mrow><mrow><msub><mi>T</mi><mi>C</mi></msub></mrow></mfrac><mo>)</mo></mrow><mn>0.326</mn></msup><mo>+</mo><msup><msub><mi>Φ</mi><mn>1</mn></msub><mo>*</mo></msup><msup><mi>N</mi><mn>0.014</mn></msup><msup><mrow><mo>(</mo><mfrac><mrow><msub><mi>T</mi><mi>C</mi></msub><mo>−</mo><mi>T</mi></mrow><mrow><msub><mi>T</mi><mi>C</mi></msub></mrow></mfrac><mo>)</mo></mrow><mn>0.827</mn></msup></math> and <i></i><math><msub><mi>Φ</mi><mi>h</mi></msub><mo>=</mo><msub><mi>Φ</mi><mi>C</mi></msub><mo>+</mo><msup><msub><mi>Φ</mi><mn>0</mn></msub><mo>*</mo></msup><msup><mi>N</mi><mrow><mo>−</mo><mn>0.22</mn></mrow></msup><msup><mrow><mo>(</mo><mfrac><mrow><msub><mi>T</mi><mi>C</mi></msub><mo>−</mo><mi>T</mi></mrow><mrow><msub><mi>T</mi><mi>C</mi></msub></mrow></mfrac><mo>)</mo></mrow><mn>0.326</mn></msup><mo>+</mo><msup><msub><mi>Φ</mi><mn>2</mn></msub><mo>*</mo></msup><msup><mi>N</mi><mn>0.014</mn></msup><msup><mrow><mo>(</mo><mfrac><mrow><msub><mi>T</mi><mi>C</mi></msub><mo>−</mo><mi>T</mi></mrow><mrow><msub><mi>T</mi><mi>C</mi></msub></mrow></mfrac><mo>)</mo></mrow><mn>0.827</mn></msup></math>for concentrations (Φ<sub>l</sub> and Φ<sub>h</sub>) lower and higher than the critical concentration (Φ<sub>C</sub>), where <i>T</i><sub>C</sub> is the critical temperature; and Φ<sub>0</sub>, Φ<sub>1</sub>, and Φ<sub>2</sub> are the chain-length independent parameters. Armed with these scaling laws, we have developed a quick optical method to map the coexistence curve of the phase diagram of each kind of polymer solution by measuring the phase transition temperatures of five or more polymer solutions with a given chain length but different concentrations to determine the five parameters Φ<sub>C</sub>, <i>T</i><sub>C</sub>, Φ<sub>0</sub>, Φ<sub>1</sub>, and Φ<sub>2</sub>.</p>","PeriodicalId":51,"journal":{"name":"Macromolecules","volume":"58 7","pages":"3471–3477 3471–3477"},"PeriodicalIF":5.2000,"publicationDate":"2025-03-25","publicationTypes":"Journal Article","fieldsOfStudy":null,"isOpenAccess":false,"openAccessPdf":"","citationCount":"0","resultStr":"{\"title\":\"New Method of Quickly Mapping Phase Diagrams of Polymer Solutions over a Wide Concentration Range\",\"authors\":\"Xiangjun Gong*, Lin Lian, Xianyu Qi, Jiahui Zhang, Wenjie Du, Juan Li, Jinliang Qiao and Chi Wu, \",\"doi\":\"10.1021/acs.macromol.4c0322310.1021/acs.macromol.4c03223\",\"DOIUrl\":null,\"url\":null,\"abstract\":\"<p >Many industrial applications require a quick method to determine the chain length-dependent phase diagram of a given polymer solution, such as converting a solution polymerization into a precipitation polymerization, to greatly save the cost. However, it is rather difficult and time-consuming to precisely map phase diagrams of polymer solutions with different chain lengths, so that good phase diagrams are scarcely documented in the literature. The difficulties come from two facts: (1) one has to prepare polymer solutions with different concentrations and chain lengths first, and then (2) measure the temperature dependent on each solution carefully, normally taking months if not years. In this study, the chain length and temperature-dependent scaling laws for linear polymer phase diagrams were established as <i></i><math><msub><mi>Φ</mi><mi>l</mi></msub><mo>=</mo><msub><mi>Φ</mi><mi>C</mi></msub><mo>−</mo><msup><msub><mi>Φ</mi><mn>0</mn></msub><mo>*</mo></msup><msup><mi>N</mi><mrow><mo>−</mo><mn>0.22</mn></mrow></msup><msup><mrow><mo>(</mo><mfrac><mrow><msub><mi>T</mi><mi>C</mi></msub><mo>−</mo><mi>T</mi></mrow><mrow><msub><mi>T</mi><mi>C</mi></msub></mrow></mfrac><mo>)</mo></mrow><mn>0.326</mn></msup><mo>+</mo><msup><msub><mi>Φ</mi><mn>1</mn></msub><mo>*</mo></msup><msup><mi>N</mi><mn>0.014</mn></msup><msup><mrow><mo>(</mo><mfrac><mrow><msub><mi>T</mi><mi>C</mi></msub><mo>−</mo><mi>T</mi></mrow><mrow><msub><mi>T</mi><mi>C</mi></msub></mrow></mfrac><mo>)</mo></mrow><mn>0.827</mn></msup></math> and <i></i><math><msub><mi>Φ</mi><mi>h</mi></msub><mo>=</mo><msub><mi>Φ</mi><mi>C</mi></msub><mo>+</mo><msup><msub><mi>Φ</mi><mn>0</mn></msub><mo>*</mo></msup><msup><mi>N</mi><mrow><mo>−</mo><mn>0.22</mn></mrow></msup><msup><mrow><mo>(</mo><mfrac><mrow><msub><mi>T</mi><mi>C</mi></msub><mo>−</mo><mi>T</mi></mrow><mrow><msub><mi>T</mi><mi>C</mi></msub></mrow></mfrac><mo>)</mo></mrow><mn>0.326</mn></msup><mo>+</mo><msup><msub><mi>Φ</mi><mn>2</mn></msub><mo>*</mo></msup><msup><mi>N</mi><mn>0.014</mn></msup><msup><mrow><mo>(</mo><mfrac><mrow><msub><mi>T</mi><mi>C</mi></msub><mo>−</mo><mi>T</mi></mrow><mrow><msub><mi>T</mi><mi>C</mi></msub></mrow></mfrac><mo>)</mo></mrow><mn>0.827</mn></msup></math>for concentrations (Φ<sub>l</sub> and Φ<sub>h</sub>) lower and higher than the critical concentration (Φ<sub>C</sub>), where <i>T</i><sub>C</sub> is the critical temperature; and Φ<sub>0</sub>, Φ<sub>1</sub>, and Φ<sub>2</sub> are the chain-length independent parameters. Armed with these scaling laws, we have developed a quick optical method to map the coexistence curve of the phase diagram of each kind of polymer solution by measuring the phase transition temperatures of five or more polymer solutions with a given chain length but different concentrations to determine the five parameters Φ<sub>C</sub>, <i>T</i><sub>C</sub>, Φ<sub>0</sub>, Φ<sub>1</sub>, and Φ<sub>2</sub>.</p>\",\"PeriodicalId\":51,\"journal\":{\"name\":\"Macromolecules\",\"volume\":\"58 7\",\"pages\":\"3471–3477 3471–3477\"},\"PeriodicalIF\":5.2000,\"publicationDate\":\"2025-03-25\",\"publicationTypes\":\"Journal Article\",\"fieldsOfStudy\":null,\"isOpenAccess\":false,\"openAccessPdf\":\"\",\"citationCount\":\"0\",\"resultStr\":null,\"platform\":\"Semanticscholar\",\"paperid\":null,\"PeriodicalName\":\"Macromolecules\",\"FirstCategoryId\":\"92\",\"ListUrlMain\":\"https://pubs.acs.org/doi/10.1021/acs.macromol.4c03223\",\"RegionNum\":1,\"RegionCategory\":\"化学\",\"ArticlePicture\":[],\"TitleCN\":null,\"AbstractTextCN\":null,\"PMCID\":null,\"EPubDate\":\"\",\"PubModel\":\"\",\"JCR\":\"Q1\",\"JCRName\":\"POLYMER SCIENCE\",\"Score\":null,\"Total\":0}","platform":"Semanticscholar","paperid":null,"PeriodicalName":"Macromolecules","FirstCategoryId":"92","ListUrlMain":"https://pubs.acs.org/doi/10.1021/acs.macromol.4c03223","RegionNum":1,"RegionCategory":"化学","ArticlePicture":[],"TitleCN":null,"AbstractTextCN":null,"PMCID":null,"EPubDate":"","PubModel":"","JCR":"Q1","JCRName":"POLYMER SCIENCE","Score":null,"Total":0}
New Method of Quickly Mapping Phase Diagrams of Polymer Solutions over a Wide Concentration Range
Many industrial applications require a quick method to determine the chain length-dependent phase diagram of a given polymer solution, such as converting a solution polymerization into a precipitation polymerization, to greatly save the cost. However, it is rather difficult and time-consuming to precisely map phase diagrams of polymer solutions with different chain lengths, so that good phase diagrams are scarcely documented in the literature. The difficulties come from two facts: (1) one has to prepare polymer solutions with different concentrations and chain lengths first, and then (2) measure the temperature dependent on each solution carefully, normally taking months if not years. In this study, the chain length and temperature-dependent scaling laws for linear polymer phase diagrams were established as and for concentrations (Φl and Φh) lower and higher than the critical concentration (ΦC), where TC is the critical temperature; and Φ0, Φ1, and Φ2 are the chain-length independent parameters. Armed with these scaling laws, we have developed a quick optical method to map the coexistence curve of the phase diagram of each kind of polymer solution by measuring the phase transition temperatures of five or more polymer solutions with a given chain length but different concentrations to determine the five parameters ΦC, TC, Φ0, Φ1, and Φ2.
期刊介绍:
Macromolecules publishes original, fundamental, and impactful research on all aspects of polymer science. Topics of interest include synthesis (e.g., controlled polymerizations, polymerization catalysis, post polymerization modification, new monomer structures and polymer architectures, and polymerization mechanisms/kinetics analysis); phase behavior, thermodynamics, dynamic, and ordering/disordering phenomena (e.g., self-assembly, gelation, crystallization, solution/melt/solid-state characteristics); structure and properties (e.g., mechanical and rheological properties, surface/interfacial characteristics, electronic and transport properties); new state of the art characterization (e.g., spectroscopy, scattering, microscopy, rheology), simulation (e.g., Monte Carlo, molecular dynamics, multi-scale/coarse-grained modeling), and theoretical methods. Renewable/sustainable polymers, polymer networks, responsive polymers, electro-, magneto- and opto-active macromolecules, inorganic polymers, charge-transporting polymers (ion-containing, semiconducting, and conducting), nanostructured polymers, and polymer composites are also of interest. Typical papers published in Macromolecules showcase important and innovative concepts, experimental methods/observations, and theoretical/computational approaches that demonstrate a fundamental advance in the understanding of polymers.
 求助内容:
求助内容: 应助结果提醒方式:


