{"title":"东南亚城市地表温度升高的变化。","authors":"Munawar Munawar, Rhysa McNeil, Rohana Jani, Suhaimee Buya, Tarmizi Tarmizi","doi":"10.1007/s10661-024-13604-z","DOIUrl":null,"url":null,"abstract":"<div><p>Climate change and global warming are terms used to describe the variation in the Earth’s mean temperature as a result of human activities contributing to the formation of urban heat islands (UHI). One method for determining the temperature of a region is the land surface temperature (LST). The study of LSTs is important and closely related to climate change, as is the provision of convenient living and working conditions in cities, which support economic growth. The NASA Moderate-Resolution Imaging Spectroradiometer (MODIS) database was utilized to gather data on the LST for each subregion from 2000 to 2022. The study area comprises 11 capital cities from Southeast Asian (SEA) nations, organized into nine sub-regional super-regions. This study used the specific area of cities as a study area different from the previous study that covered islands. The objective of the present study was to employ a cubic spline model with seven or eight nodes to assess the periodicity and fluctuations in LST in SEA cities. A 95% confidence interval was then created using the LST variation. An adequate representation of the cyclical pattern in the cubic spline equation required eight knots. The research revealed a statistically significant increase in the mean daily LST in 8 of the 11 SEA super-regions. The findings showed a confidence interval of [0.295, 0.447] °C at the 95% confidence level and an overall average increase in the LST at SEA of 0.371 °C per decade. While the LST increased in Jakarta, Hanoi, Vientiane, Bangkok, Kuala Lumpur, Singapore, and Phnom Penh, it remained unchanged in the Bandar Seri Begawan super-region. On the other hand, the LST was slightly lower in Naypyidaw and marginally greater in Manila. An increase in LST in SEA cities indicates global warming due to reduced green areas.</p></div>","PeriodicalId":544,"journal":{"name":"Environmental Monitoring and Assessment","volume":"197 2","pages":""},"PeriodicalIF":3.0000,"publicationDate":"2025-01-24","publicationTypes":"Journal Article","fieldsOfStudy":null,"isOpenAccess":false,"openAccessPdf":"","citationCount":"0","resultStr":"{\"title\":\"Variations in land surface temperature increase in South-East Asian Cities\",\"authors\":\"Munawar Munawar, Rhysa McNeil, Rohana Jani, Suhaimee Buya, Tarmizi Tarmizi\",\"doi\":\"10.1007/s10661-024-13604-z\",\"DOIUrl\":null,\"url\":null,\"abstract\":\"<div><p>Climate change and global warming are terms used to describe the variation in the Earth’s mean temperature as a result of human activities contributing to the formation of urban heat islands (UHI). One method for determining the temperature of a region is the land surface temperature (LST). The study of LSTs is important and closely related to climate change, as is the provision of convenient living and working conditions in cities, which support economic growth. The NASA Moderate-Resolution Imaging Spectroradiometer (MODIS) database was utilized to gather data on the LST for each subregion from 2000 to 2022. The study area comprises 11 capital cities from Southeast Asian (SEA) nations, organized into nine sub-regional super-regions. This study used the specific area of cities as a study area different from the previous study that covered islands. The objective of the present study was to employ a cubic spline model with seven or eight nodes to assess the periodicity and fluctuations in LST in SEA cities. A 95% confidence interval was then created using the LST variation. An adequate representation of the cyclical pattern in the cubic spline equation required eight knots. The research revealed a statistically significant increase in the mean daily LST in 8 of the 11 SEA super-regions. The findings showed a confidence interval of [0.295, 0.447] °C at the 95% confidence level and an overall average increase in the LST at SEA of 0.371 °C per decade. While the LST increased in Jakarta, Hanoi, Vientiane, Bangkok, Kuala Lumpur, Singapore, and Phnom Penh, it remained unchanged in the Bandar Seri Begawan super-region. On the other hand, the LST was slightly lower in Naypyidaw and marginally greater in Manila. An increase in LST in SEA cities indicates global warming due to reduced green areas.</p></div>\",\"PeriodicalId\":544,\"journal\":{\"name\":\"Environmental Monitoring and Assessment\",\"volume\":\"197 2\",\"pages\":\"\"},\"PeriodicalIF\":3.0000,\"publicationDate\":\"2025-01-24\",\"publicationTypes\":\"Journal Article\",\"fieldsOfStudy\":null,\"isOpenAccess\":false,\"openAccessPdf\":\"\",\"citationCount\":\"0\",\"resultStr\":null,\"platform\":\"Semanticscholar\",\"paperid\":null,\"PeriodicalName\":\"Environmental Monitoring and Assessment\",\"FirstCategoryId\":\"93\",\"ListUrlMain\":\"https://link.springer.com/article/10.1007/s10661-024-13604-z\",\"RegionNum\":4,\"RegionCategory\":\"环境科学与生态学\",\"ArticlePicture\":[],\"TitleCN\":null,\"AbstractTextCN\":null,\"PMCID\":null,\"EPubDate\":\"\",\"PubModel\":\"\",\"JCR\":\"Q3\",\"JCRName\":\"ENVIRONMENTAL SCIENCES\",\"Score\":null,\"Total\":0}","platform":"Semanticscholar","paperid":null,"PeriodicalName":"Environmental Monitoring and Assessment","FirstCategoryId":"93","ListUrlMain":"https://link.springer.com/article/10.1007/s10661-024-13604-z","RegionNum":4,"RegionCategory":"环境科学与生态学","ArticlePicture":[],"TitleCN":null,"AbstractTextCN":null,"PMCID":null,"EPubDate":"","PubModel":"","JCR":"Q3","JCRName":"ENVIRONMENTAL SCIENCES","Score":null,"Total":0}
Variations in land surface temperature increase in South-East Asian Cities
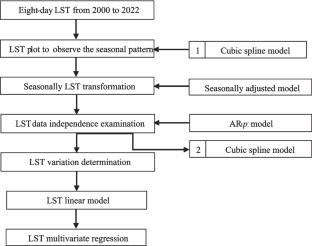
Climate change and global warming are terms used to describe the variation in the Earth’s mean temperature as a result of human activities contributing to the formation of urban heat islands (UHI). One method for determining the temperature of a region is the land surface temperature (LST). The study of LSTs is important and closely related to climate change, as is the provision of convenient living and working conditions in cities, which support economic growth. The NASA Moderate-Resolution Imaging Spectroradiometer (MODIS) database was utilized to gather data on the LST for each subregion from 2000 to 2022. The study area comprises 11 capital cities from Southeast Asian (SEA) nations, organized into nine sub-regional super-regions. This study used the specific area of cities as a study area different from the previous study that covered islands. The objective of the present study was to employ a cubic spline model with seven or eight nodes to assess the periodicity and fluctuations in LST in SEA cities. A 95% confidence interval was then created using the LST variation. An adequate representation of the cyclical pattern in the cubic spline equation required eight knots. The research revealed a statistically significant increase in the mean daily LST in 8 of the 11 SEA super-regions. The findings showed a confidence interval of [0.295, 0.447] °C at the 95% confidence level and an overall average increase in the LST at SEA of 0.371 °C per decade. While the LST increased in Jakarta, Hanoi, Vientiane, Bangkok, Kuala Lumpur, Singapore, and Phnom Penh, it remained unchanged in the Bandar Seri Begawan super-region. On the other hand, the LST was slightly lower in Naypyidaw and marginally greater in Manila. An increase in LST in SEA cities indicates global warming due to reduced green areas.
期刊介绍:
Environmental Monitoring and Assessment emphasizes technical developments and data arising from environmental monitoring and assessment, the use of scientific principles in the design of monitoring systems at the local, regional and global scales, and the use of monitoring data in assessing the consequences of natural resource management actions and pollution risks to man and the environment.
 求助内容:
求助内容: 应助结果提醒方式:


