Jakub Mesinovic, Mícheál Ó Breasail, Lauren A Burt, Cat Shore-Lorenti, Roger Zebaze, Camelia Q E Lim, Zihui Ling, Peter R Ebeling, David Scott, Ayse Zengin
{"title":"DXA、pQCT和HR-pQCT骨成像模式的精确性和一致性。","authors":"Jakub Mesinovic, Mícheál Ó Breasail, Lauren A Burt, Cat Shore-Lorenti, Roger Zebaze, Camelia Q E Lim, Zihui Ling, Peter R Ebeling, David Scott, Ayse Zengin","doi":"10.1093/jbmrpl/ziae158","DOIUrl":null,"url":null,"abstract":"<p><p>Quantifying precision error for DXA, peripheral QCT (pQCT), and HR-pQCT is crucial for monitoring longitudinal changes in body composition and musculoskeletal outcomes. Agreement and associations between bone variables assessed using pQCT and second-generation HR-pQCT are unclear. This study aimed to determine the precision of, and agreement and associations between, bone variables assessed via DXA, pQCT, and second-generation HR-pQCT. Thirty older adults (mean age: 64.2 <b>±</b> 8.0 yr; women: 67%) were recruited. DXA scans were performed at the total hip, lumbar spine, and whole body. Distal (4%) and proximal (30%/33%/66%) skeletal sites at the radius and tibia were scanned with pQCT and/or HR-pQCT. Root-mean-squared coefficients of variation (%CV<sub>RMS</sub>) were calculated to define precision errors, and Bland-Altman plots assessed agreement between densitometric estimates. Pearson correlations and linear regression explored relationships between bone variables at different skeletal sites and proportional bias, respectively. Precision errors ranged between 0.55% and 1.6% for DXA, 0.40% and 4.8% for pQCT, and 0.13% and 30.7% for HR-pQCT. Systematic bias was identified between pQCT- and HR-pQCT-determined radius and tibia volumetric BMD (vBMD) estimates (all <i>p</i><.001). Proportional bias was not observed between vBMD measures at any skeletal site (all <i>p</i>>.05). pQCT- and HR-pQCT-determined total, trabecular, and cortical vBMD and estimates of bone strength at the radius and tibia were strongly correlated (all <i>p</i><.05). Precision error was low for most bone variables and within the expected range for all imaging modalities. We observed significant systematic bias, but no proportional bias, between pQCT- and second-generation HR-pQCT-determined vBMD estimates at the radius and tibia. Nevertheless, measures of bone density and strength were strongly correlated at all skeletal sites. These findings suggest that although bone density and strength estimates from both imaging modalities are not interchangeable, they are strongly related and likely have similar fracture prediction capabilities.</p>","PeriodicalId":14611,"journal":{"name":"JBMR Plus","volume":"9 2","pages":"ziae158"},"PeriodicalIF":2.4000,"publicationDate":"2024-12-03","publicationTypes":"Journal Article","fieldsOfStudy":null,"isOpenAccess":false,"openAccessPdf":"https://www.ncbi.nlm.nih.gov/pmc/articles/PMC11752644/pdf/","citationCount":"0","resultStr":"{\"title\":\"Bone imaging modality precision and agreement between DXA, pQCT, and HR-pQCT.\",\"authors\":\"Jakub Mesinovic, Mícheál Ó Breasail, Lauren A Burt, Cat Shore-Lorenti, Roger Zebaze, Camelia Q E Lim, Zihui Ling, Peter R Ebeling, David Scott, Ayse Zengin\",\"doi\":\"10.1093/jbmrpl/ziae158\",\"DOIUrl\":null,\"url\":null,\"abstract\":\"<p><p>Quantifying precision error for DXA, peripheral QCT (pQCT), and HR-pQCT is crucial for monitoring longitudinal changes in body composition and musculoskeletal outcomes. Agreement and associations between bone variables assessed using pQCT and second-generation HR-pQCT are unclear. This study aimed to determine the precision of, and agreement and associations between, bone variables assessed via DXA, pQCT, and second-generation HR-pQCT. Thirty older adults (mean age: 64.2 <b>±</b> 8.0 yr; women: 67%) were recruited. DXA scans were performed at the total hip, lumbar spine, and whole body. Distal (4%) and proximal (30%/33%/66%) skeletal sites at the radius and tibia were scanned with pQCT and/or HR-pQCT. Root-mean-squared coefficients of variation (%CV<sub>RMS</sub>) were calculated to define precision errors, and Bland-Altman plots assessed agreement between densitometric estimates. Pearson correlations and linear regression explored relationships between bone variables at different skeletal sites and proportional bias, respectively. Precision errors ranged between 0.55% and 1.6% for DXA, 0.40% and 4.8% for pQCT, and 0.13% and 30.7% for HR-pQCT. Systematic bias was identified between pQCT- and HR-pQCT-determined radius and tibia volumetric BMD (vBMD) estimates (all <i>p</i><.001). Proportional bias was not observed between vBMD measures at any skeletal site (all <i>p</i>>.05). pQCT- and HR-pQCT-determined total, trabecular, and cortical vBMD and estimates of bone strength at the radius and tibia were strongly correlated (all <i>p</i><.05). Precision error was low for most bone variables and within the expected range for all imaging modalities. We observed significant systematic bias, but no proportional bias, between pQCT- and second-generation HR-pQCT-determined vBMD estimates at the radius and tibia. Nevertheless, measures of bone density and strength were strongly correlated at all skeletal sites. These findings suggest that although bone density and strength estimates from both imaging modalities are not interchangeable, they are strongly related and likely have similar fracture prediction capabilities.</p>\",\"PeriodicalId\":14611,\"journal\":{\"name\":\"JBMR Plus\",\"volume\":\"9 2\",\"pages\":\"ziae158\"},\"PeriodicalIF\":2.4000,\"publicationDate\":\"2024-12-03\",\"publicationTypes\":\"Journal Article\",\"fieldsOfStudy\":null,\"isOpenAccess\":false,\"openAccessPdf\":\"https://www.ncbi.nlm.nih.gov/pmc/articles/PMC11752644/pdf/\",\"citationCount\":\"0\",\"resultStr\":null,\"platform\":\"Semanticscholar\",\"paperid\":null,\"PeriodicalName\":\"JBMR Plus\",\"FirstCategoryId\":\"1085\",\"ListUrlMain\":\"https://doi.org/10.1093/jbmrpl/ziae158\",\"RegionNum\":0,\"RegionCategory\":null,\"ArticlePicture\":[],\"TitleCN\":null,\"AbstractTextCN\":null,\"PMCID\":null,\"EPubDate\":\"2025/2/1 0:00:00\",\"PubModel\":\"eCollection\",\"JCR\":\"Q2\",\"JCRName\":\"ENDOCRINOLOGY & METABOLISM\",\"Score\":null,\"Total\":0}","platform":"Semanticscholar","paperid":null,"PeriodicalName":"JBMR Plus","FirstCategoryId":"1085","ListUrlMain":"https://doi.org/10.1093/jbmrpl/ziae158","RegionNum":0,"RegionCategory":null,"ArticlePicture":[],"TitleCN":null,"AbstractTextCN":null,"PMCID":null,"EPubDate":"2025/2/1 0:00:00","PubModel":"eCollection","JCR":"Q2","JCRName":"ENDOCRINOLOGY & METABOLISM","Score":null,"Total":0}
Bone imaging modality precision and agreement between DXA, pQCT, and HR-pQCT.
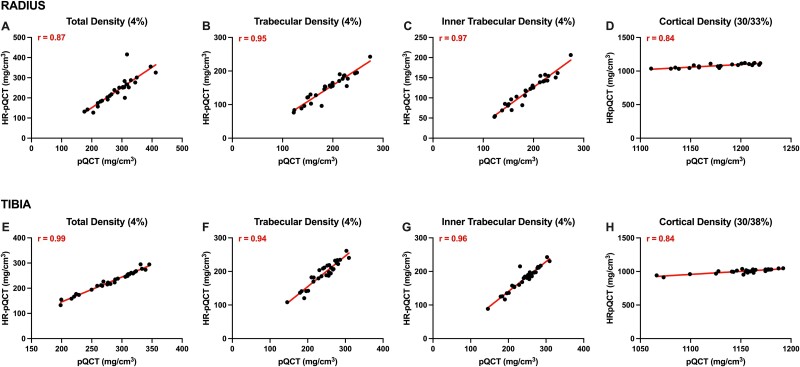
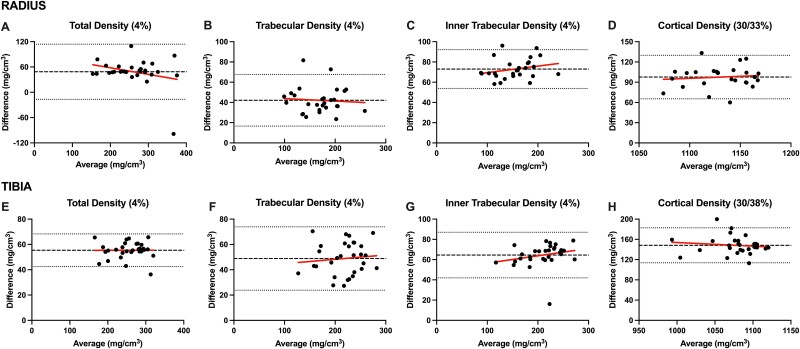
Quantifying precision error for DXA, peripheral QCT (pQCT), and HR-pQCT is crucial for monitoring longitudinal changes in body composition and musculoskeletal outcomes. Agreement and associations between bone variables assessed using pQCT and second-generation HR-pQCT are unclear. This study aimed to determine the precision of, and agreement and associations between, bone variables assessed via DXA, pQCT, and second-generation HR-pQCT. Thirty older adults (mean age: 64.2 ± 8.0 yr; women: 67%) were recruited. DXA scans were performed at the total hip, lumbar spine, and whole body. Distal (4%) and proximal (30%/33%/66%) skeletal sites at the radius and tibia were scanned with pQCT and/or HR-pQCT. Root-mean-squared coefficients of variation (%CVRMS) were calculated to define precision errors, and Bland-Altman plots assessed agreement between densitometric estimates. Pearson correlations and linear regression explored relationships between bone variables at different skeletal sites and proportional bias, respectively. Precision errors ranged between 0.55% and 1.6% for DXA, 0.40% and 4.8% for pQCT, and 0.13% and 30.7% for HR-pQCT. Systematic bias was identified between pQCT- and HR-pQCT-determined radius and tibia volumetric BMD (vBMD) estimates (all p<.001). Proportional bias was not observed between vBMD measures at any skeletal site (all p>.05). pQCT- and HR-pQCT-determined total, trabecular, and cortical vBMD and estimates of bone strength at the radius and tibia were strongly correlated (all p<.05). Precision error was low for most bone variables and within the expected range for all imaging modalities. We observed significant systematic bias, but no proportional bias, between pQCT- and second-generation HR-pQCT-determined vBMD estimates at the radius and tibia. Nevertheless, measures of bone density and strength were strongly correlated at all skeletal sites. These findings suggest that although bone density and strength estimates from both imaging modalities are not interchangeable, they are strongly related and likely have similar fracture prediction capabilities.

 求助内容:
求助内容: 应助结果提醒方式:


