{"title":"将空间剂量分布可视化,以便在介入放射学中开展有效的辐射防护教育:获取高精度空间剂量。","authors":"Yutaro Mori, Tomonori Isobe, Yasuwo Ide, Shuto Uematsu, Tetsuya Tomita, Yoshiaki Nagai, Takashi Iizumi, Hideyuki Takei, Hideyuki Sakurai, Takeji Sakae","doi":"10.1007/s13246-024-01479-w","DOIUrl":null,"url":null,"abstract":"<p><p>In recent years, eye lens exposure among radiation workers has become a serious concern in medical X-ray fluoroscopy and interventional radiology (IVR), highlighting the need for radiation protection education and training. This study presents a method that can maintain high accuracy when calculating spatial dose distributions obtained via Monte Carlo simulation and establishes another method to three-dimensionally visualize radiation using the obtained calculation results for contributing to effective radiation-protection education in X-ray fluoroscopy and IVR. The Monte Carlo particle and heavy ion transport code system (PHITS, Ver. 3.24) was used for calculating the spatial dose distribution generated by an angiography device. We determined the peak X-ray tube voltage and half value layer using Raysafe X2 to define the X-ray spectrum from the source and calculated the X-ray spectrum from the measured results using an approximation formula developed by Tucker et al. Further, we performed measurements using the \"jungle-gym\" method under the same conditions as the Monte Carlo calculations for verifying the accuracy of the latter. An optically stimulated luminescence dosimeter (nanoDot dosimeter) was used as the measuring instrument. In addition, we attempted to visualize radiation using ParaView (version 5.12.0-RC2) using the spatial dose distribution confirmed by the above calculations. A comparison of the measured and Monte Carlo calculated spatial dose distributions revealed that some areas showed large errors (12.3 and 24.2%) between the two values. These errors could be attributed to the scattering and absorption of X-rays caused by the jungle gym method, which led to uncertain measurements, and (2) the angular and energy dependencies of the nanoDot dosimetry. These two causes explain the errors in the actual values, and thus, the Monte Carlo calculations proposed in this study can be considered to have high-quality X-ray spectra and high accuracy. We successfully visualized the three-dimensional spatial dose distribution for direct and scattered X-rays separately using the obtained spatial dose distribution. We established a method to verify the accuracy of Monte Carlo calculations performed through the procedures considered in this study. Various three-dimensional spatial dose distributions were obtained with assured accuracy by applying the Monte Carlo calculation (e.g., changing the irradiation angle and adding a protective plate). Effective radiation-protection education can be realized by combining the present method with highly reliable software to visualize dose distributions.</p>","PeriodicalId":48490,"journal":{"name":"Physical and Engineering Sciences in Medicine","volume":" ","pages":"1665-1676"},"PeriodicalIF":2.4000,"publicationDate":"2024-12-01","publicationTypes":"Journal Article","fieldsOfStudy":null,"isOpenAccess":false,"openAccessPdf":"https://www.ncbi.nlm.nih.gov/pmc/articles/PMC11666685/pdf/","citationCount":"0","resultStr":"{\"title\":\"Visualization of spatial dose distribution for effective radiation protection education in interventional radiology: obtaining high-accuracy spatial doses.\",\"authors\":\"Yutaro Mori, Tomonori Isobe, Yasuwo Ide, Shuto Uematsu, Tetsuya Tomita, Yoshiaki Nagai, Takashi Iizumi, Hideyuki Takei, Hideyuki Sakurai, Takeji Sakae\",\"doi\":\"10.1007/s13246-024-01479-w\",\"DOIUrl\":null,\"url\":null,\"abstract\":\"<p><p>In recent years, eye lens exposure among radiation workers has become a serious concern in medical X-ray fluoroscopy and interventional radiology (IVR), highlighting the need for radiation protection education and training. This study presents a method that can maintain high accuracy when calculating spatial dose distributions obtained via Monte Carlo simulation and establishes another method to three-dimensionally visualize radiation using the obtained calculation results for contributing to effective radiation-protection education in X-ray fluoroscopy and IVR. The Monte Carlo particle and heavy ion transport code system (PHITS, Ver. 3.24) was used for calculating the spatial dose distribution generated by an angiography device. We determined the peak X-ray tube voltage and half value layer using Raysafe X2 to define the X-ray spectrum from the source and calculated the X-ray spectrum from the measured results using an approximation formula developed by Tucker et al. Further, we performed measurements using the \\\"jungle-gym\\\" method under the same conditions as the Monte Carlo calculations for verifying the accuracy of the latter. An optically stimulated luminescence dosimeter (nanoDot dosimeter) was used as the measuring instrument. In addition, we attempted to visualize radiation using ParaView (version 5.12.0-RC2) using the spatial dose distribution confirmed by the above calculations. A comparison of the measured and Monte Carlo calculated spatial dose distributions revealed that some areas showed large errors (12.3 and 24.2%) between the two values. These errors could be attributed to the scattering and absorption of X-rays caused by the jungle gym method, which led to uncertain measurements, and (2) the angular and energy dependencies of the nanoDot dosimetry. These two causes explain the errors in the actual values, and thus, the Monte Carlo calculations proposed in this study can be considered to have high-quality X-ray spectra and high accuracy. We successfully visualized the three-dimensional spatial dose distribution for direct and scattered X-rays separately using the obtained spatial dose distribution. We established a method to verify the accuracy of Monte Carlo calculations performed through the procedures considered in this study. Various three-dimensional spatial dose distributions were obtained with assured accuracy by applying the Monte Carlo calculation (e.g., changing the irradiation angle and adding a protective plate). Effective radiation-protection education can be realized by combining the present method with highly reliable software to visualize dose distributions.</p>\",\"PeriodicalId\":48490,\"journal\":{\"name\":\"Physical and Engineering Sciences in Medicine\",\"volume\":\" \",\"pages\":\"1665-1676\"},\"PeriodicalIF\":2.4000,\"publicationDate\":\"2024-12-01\",\"publicationTypes\":\"Journal Article\",\"fieldsOfStudy\":null,\"isOpenAccess\":false,\"openAccessPdf\":\"https://www.ncbi.nlm.nih.gov/pmc/articles/PMC11666685/pdf/\",\"citationCount\":\"0\",\"resultStr\":null,\"platform\":\"Semanticscholar\",\"paperid\":null,\"PeriodicalName\":\"Physical and Engineering Sciences in Medicine\",\"FirstCategoryId\":\"3\",\"ListUrlMain\":\"https://doi.org/10.1007/s13246-024-01479-w\",\"RegionNum\":4,\"RegionCategory\":\"医学\",\"ArticlePicture\":[],\"TitleCN\":null,\"AbstractTextCN\":null,\"PMCID\":null,\"EPubDate\":\"2024/9/9 0:00:00\",\"PubModel\":\"Epub\",\"JCR\":\"Q3\",\"JCRName\":\"ENGINEERING, BIOMEDICAL\",\"Score\":null,\"Total\":0}","platform":"Semanticscholar","paperid":null,"PeriodicalName":"Physical and Engineering Sciences in Medicine","FirstCategoryId":"3","ListUrlMain":"https://doi.org/10.1007/s13246-024-01479-w","RegionNum":4,"RegionCategory":"医学","ArticlePicture":[],"TitleCN":null,"AbstractTextCN":null,"PMCID":null,"EPubDate":"2024/9/9 0:00:00","PubModel":"Epub","JCR":"Q3","JCRName":"ENGINEERING, BIOMEDICAL","Score":null,"Total":0}
引用次数: 0
摘要
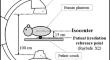
近年来,在医用 X 射线透视和介入放射学(IVR)领域,放射工作人员的眼部晶状体暴露已成为一个令人严重关切的问题,这凸显了辐射防护教育和培训的必要性。本研究提出了一种通过蒙特卡洛模拟计算空间剂量分布时可保持高精度的方法,并利用计算结果建立了另一种辐射三维可视化方法,以促进 X 射线透视和 IVR 中有效的辐射防护教育。我们使用蒙特卡洛粒子和重离子传输代码系统(PHITS,3.24 版)计算血管造影设备产生的空间剂量分布。我们使用 Raysafe X2 确定了 X 射线管的峰值电压和半值层,从而定义了射线源的 X 射线频谱,并使用 Tucker 等人开发的近似公式根据测量结果计算了 X 射线频谱。此外,我们还在与蒙特卡罗计算相同的条件下使用 "丛林健身房 "方法进行了测量,以验证后者的准确性。我们使用了光学激发发光剂量计(nanoDot 剂量计)作为测量仪器。此外,我们还尝试使用 ParaView(5.12.0-RC2 版),根据上述计算确认的空间剂量分布对辐射进行可视化。对测量值和蒙特卡罗计算值的空间剂量分布进行比较后发现,某些区域的空间剂量分布与测量值之间存在较大误差(12.3% 和 24.2%)。这些误差可归因于丛林健身法造成的 X 射线散射和吸收,从而导致测量结果的不确定性,以及 (2) 纳米点剂量测定的角度和能量依赖性。这两个原因解释了实际值的误差,因此可以认为本研究提出的蒙特卡罗计算具有高质量的 X 射线光谱和高精度。我们利用所获得的空间剂量分布,成功地分别可视化了直射和散射 X 射线的三维空间剂量分布。我们建立了一种方法来验证通过本研究程序进行的蒙特卡罗计算的准确性。通过蒙特卡洛计算(例如改变照射角度和添加防护板),我们获得了各种三维空间剂量分布,并确保了其准确性。将本方法与高可靠性的剂量分布可视化软件相结合,可以实现有效的辐射防护教育。
Visualization of spatial dose distribution for effective radiation protection education in interventional radiology: obtaining high-accuracy spatial doses.
In recent years, eye lens exposure among radiation workers has become a serious concern in medical X-ray fluoroscopy and interventional radiology (IVR), highlighting the need for radiation protection education and training. This study presents a method that can maintain high accuracy when calculating spatial dose distributions obtained via Monte Carlo simulation and establishes another method to three-dimensionally visualize radiation using the obtained calculation results for contributing to effective radiation-protection education in X-ray fluoroscopy and IVR. The Monte Carlo particle and heavy ion transport code system (PHITS, Ver. 3.24) was used for calculating the spatial dose distribution generated by an angiography device. We determined the peak X-ray tube voltage and half value layer using Raysafe X2 to define the X-ray spectrum from the source and calculated the X-ray spectrum from the measured results using an approximation formula developed by Tucker et al. Further, we performed measurements using the "jungle-gym" method under the same conditions as the Monte Carlo calculations for verifying the accuracy of the latter. An optically stimulated luminescence dosimeter (nanoDot dosimeter) was used as the measuring instrument. In addition, we attempted to visualize radiation using ParaView (version 5.12.0-RC2) using the spatial dose distribution confirmed by the above calculations. A comparison of the measured and Monte Carlo calculated spatial dose distributions revealed that some areas showed large errors (12.3 and 24.2%) between the two values. These errors could be attributed to the scattering and absorption of X-rays caused by the jungle gym method, which led to uncertain measurements, and (2) the angular and energy dependencies of the nanoDot dosimetry. These two causes explain the errors in the actual values, and thus, the Monte Carlo calculations proposed in this study can be considered to have high-quality X-ray spectra and high accuracy. We successfully visualized the three-dimensional spatial dose distribution for direct and scattered X-rays separately using the obtained spatial dose distribution. We established a method to verify the accuracy of Monte Carlo calculations performed through the procedures considered in this study. Various three-dimensional spatial dose distributions were obtained with assured accuracy by applying the Monte Carlo calculation (e.g., changing the irradiation angle and adding a protective plate). Effective radiation-protection education can be realized by combining the present method with highly reliable software to visualize dose distributions.
 求助内容:
求助内容: 应助结果提醒方式:


