{"title":"日本糖尿病蜡烛图","authors":"Diana Boj-Carceller","doi":"10.5662/wjm.v14.i2.90708","DOIUrl":null,"url":null,"abstract":"<p><p>Continuous glucose monitoring (CGM) is a popular technology among the diabetic population, especially in patients with type 1 diabetes and those with type 2 diabetes treated with insulin. The American Diabetes Association recommends standardization of CGM reports with visual cues, such as the ambulatory glucose profile. Nevertheless, interpreting this report requires training and time for CGM to be cost-efficient. In this work it has been proposed to incorporate Japanese candlestick charts in glucose monitoring. These graphs are used in price analysis in financial markets and are easier to view. Each candle provides extra information to make prudent decisions since it reports the opening, maximum, minimum and closing glucose levels of the chosen time frame, usually the daily one. The Japanese candlestick chart is an interesting tool to be considered in glucose control. This graphic representation allows identification of glucose trends easily through the colors of the candles and maximum and minimum glucose values.</p>","PeriodicalId":94271,"journal":{"name":"World journal of methodology","volume":"14 2","pages":"90708"},"PeriodicalIF":0.0000,"publicationDate":"2024-06-20","publicationTypes":"Journal Article","fieldsOfStudy":null,"isOpenAccess":false,"openAccessPdf":"https://www.ncbi.nlm.nih.gov/pmc/articles/PMC11229871/pdf/","citationCount":"0","resultStr":"{\"title\":\"Japanese candlestick charts for diabetes.\",\"authors\":\"Diana Boj-Carceller\",\"doi\":\"10.5662/wjm.v14.i2.90708\",\"DOIUrl\":null,\"url\":null,\"abstract\":\"<p><p>Continuous glucose monitoring (CGM) is a popular technology among the diabetic population, especially in patients with type 1 diabetes and those with type 2 diabetes treated with insulin. The American Diabetes Association recommends standardization of CGM reports with visual cues, such as the ambulatory glucose profile. Nevertheless, interpreting this report requires training and time for CGM to be cost-efficient. In this work it has been proposed to incorporate Japanese candlestick charts in glucose monitoring. These graphs are used in price analysis in financial markets and are easier to view. Each candle provides extra information to make prudent decisions since it reports the opening, maximum, minimum and closing glucose levels of the chosen time frame, usually the daily one. The Japanese candlestick chart is an interesting tool to be considered in glucose control. This graphic representation allows identification of glucose trends easily through the colors of the candles and maximum and minimum glucose values.</p>\",\"PeriodicalId\":94271,\"journal\":{\"name\":\"World journal of methodology\",\"volume\":\"14 2\",\"pages\":\"90708\"},\"PeriodicalIF\":0.0000,\"publicationDate\":\"2024-06-20\",\"publicationTypes\":\"Journal Article\",\"fieldsOfStudy\":null,\"isOpenAccess\":false,\"openAccessPdf\":\"https://www.ncbi.nlm.nih.gov/pmc/articles/PMC11229871/pdf/\",\"citationCount\":\"0\",\"resultStr\":null,\"platform\":\"Semanticscholar\",\"paperid\":null,\"PeriodicalName\":\"World journal of methodology\",\"FirstCategoryId\":\"1085\",\"ListUrlMain\":\"https://doi.org/10.5662/wjm.v14.i2.90708\",\"RegionNum\":0,\"RegionCategory\":null,\"ArticlePicture\":[],\"TitleCN\":null,\"AbstractTextCN\":null,\"PMCID\":null,\"EPubDate\":\"\",\"PubModel\":\"\",\"JCR\":\"\",\"JCRName\":\"\",\"Score\":null,\"Total\":0}","platform":"Semanticscholar","paperid":null,"PeriodicalName":"World journal of methodology","FirstCategoryId":"1085","ListUrlMain":"https://doi.org/10.5662/wjm.v14.i2.90708","RegionNum":0,"RegionCategory":null,"ArticlePicture":[],"TitleCN":null,"AbstractTextCN":null,"PMCID":null,"EPubDate":"","PubModel":"","JCR":"","JCRName":"","Score":null,"Total":0}
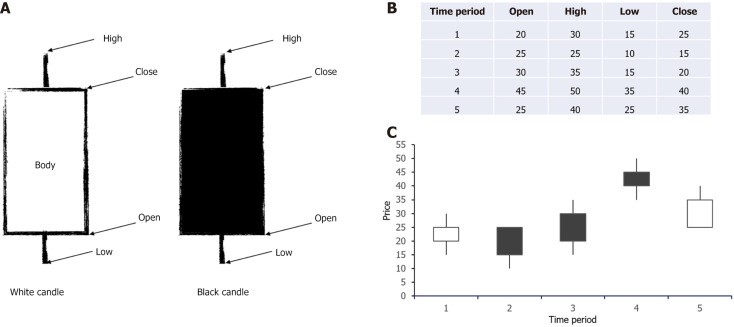
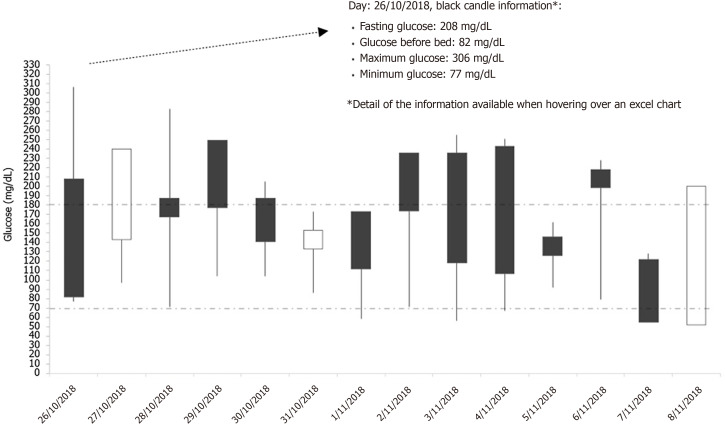
Continuous glucose monitoring (CGM) is a popular technology among the diabetic population, especially in patients with type 1 diabetes and those with type 2 diabetes treated with insulin. The American Diabetes Association recommends standardization of CGM reports with visual cues, such as the ambulatory glucose profile. Nevertheless, interpreting this report requires training and time for CGM to be cost-efficient. In this work it has been proposed to incorporate Japanese candlestick charts in glucose monitoring. These graphs are used in price analysis in financial markets and are easier to view. Each candle provides extra information to make prudent decisions since it reports the opening, maximum, minimum and closing glucose levels of the chosen time frame, usually the daily one. The Japanese candlestick chart is an interesting tool to be considered in glucose control. This graphic representation allows identification of glucose trends easily through the colors of the candles and maximum and minimum glucose values.

 求助内容:
求助内容: 应助结果提醒方式:


