{"title":"自发荧光:从负担到益处。","authors":"Katherine R. Pilkington","doi":"10.1002/cyto.a.24885","DOIUrl":null,"url":null,"abstract":"<p>With the progression from conventional flow cytometry to full spectrum flow cytometry moving as fast as manufacturers create new reagents to expand our fluorochrome palette, a certain factor of flow cytometric analysis continues to appear as a major challenge in data analysis: cellular autofluorescence (AF). More specifically, heterogeneity of cellular AF. The idea of AF in our cytometry assays is not new, one must only search the term “autofluorescence” in this journal to see nearly 1000 publications associated with the subject dating back to the earliest days of publication (<span>1</span>). However, the way we manage and interact with AF in our analysis is evolving at pace with technological advancements and our experimental demands.</p><p>AF is any light emitted from cells by endogenous cellular components that fluoresce. Components like collagen, elastin, tryptophan, NADH, and flavins to name just a few (<span>2</span>), the emission of these components falls predominantly between 400 and 600 nm in mammalian cells. These components, and many others, contribute to the variety of cellular AF found within samples. Cell type, size, granularity, and metabolic state all contribute to variations in AF (<span>2, 3</span>).</p><p>Historically, when encountering a sample with high AF, such as that from an enzymatically digested tissue, one would simply choose red and far-red emitting fluorochromes, thus avoiding the shorter wavelengths most impacted by autofluorescence. In addition, voltages of detectors were often decreased to lower the visual impact of the AF, but this method also dampens the sensitivity of the detector with respect to the intended fluorochrome for analysis. With conventional cytometers and 6–8 parameter assays, this strategy was somewhat effective, but very limiting. The increasing demand to analyze more parameters from each sample means researchers need to embrace new analysis strategies.</p><p>The burden that AF complexity contributes to our assays is easily recognized within our data, but what benefits can we reap if we take the time to optimize our analysis strategies? Without proper care and consideration, data with incorrectly managed heterogeneous AF can result in masking of poorly expressed tertiary markers (<span>4</span>) and even misclassification of cellular phenotypes when AF is incorrectly identified as fluorochrome signal (<span>5</span>). With these potential complications, it is essential to design panels for samples with heterogenous AF to minimize its impact on marker detection and resolution.</p><p>With a spectral flow cytometer, the unique AF properties of different samples can be characterized and leveraged when designing new panels. By thinking of the spectral signature of the AF as just another fluorochrome and implementing good panel design practices with respect to antigen coexpression, fluorochrome brightness, and fluorochrome similarity (<span>6</span>), marker resolution can be substantially improved. This strategy is straightforward for simple sample types with homogeneous AF, such as PBMCs, but challenges arise when dealing with heterogeneous samples, such as from digested tissues and stimulation cultures. In order of appearance in the workflow these challenges are: identification of multiple unique AF signatures, selection of appropriate signatures for incorporation in spectral unmixing, application of those signatures as reference controls in unmixing, and assessment of the unmixing outcome.</p><p>Several recent publications have described workflows and methodologies for maximizing information from samples with high and heterogeneous AF. Peixoto et al. describe identification of different populations of fetal liver cells and analysis of markers in conjunction with individual AF signatures (<span>7</span>). Kharraz et al. described a 16-color panel in mouse skeletal muscle and the subsequent improvement in marker resolution and evaluation, a larger panel than could be achieved without spectral flow cytometry and multiple autofluorescence analysis strategies (<span>5</span>). More recently Jameson et al. described the identification of multiple AF signatures using high-dimensional reduction and the resultant improvement in data resolution when incorporating additional AF signatures (<span>4</span>), importantly, in this instance, without the improvement from the multi-AF workflow, the AF was masking their ability to detect the tdTomato reporter protein.</p><p>When conducting spectral unmixing compared to compensation the intended outcome is the same, we wish to determine the contribution from each fluorochrome in the multicolor mixture. The experiment conducted on the bench is identical, the same single-stained controls are required to delineate the fluorochromes in the assay, but when it comes time to deconvolute, the mathematical calculation itself is different (<span>8</span>). Unmixing uses reference signatures to calculate the contribution from each fluorochrome in a mixture. For accurate determination of the contribution from the exogenous fluorochromes used in the experiment, every source of fluorescence must be referenced, including the endogenous AF.</p><p>The first challenge in data analysis when dealing with samples containing heterogeneous AF is identifying each of the unique AF signatures present within the sample. There are three commonly used methods for this process. First adopted was a method that involves discovery of the unique signatures by analysis of the raw spectral parameter Nx1 or NxN permutations of the unstained sample to identify, which pairing of detectors would discriminate the greatest number of populations, with further segmentation by other parameter pairings if populations remained heterogeneous after this gating method (Figure 1A). The second method is an extrapolation of the first and involves assessment of the <i>unmixed</i> unstained sample where autofluorescence is extracted based on placing a single scatter gate on a population with as discrete a signature as possible, then plotting the AF parameter versus every other fluorochrome in the assay. With this method, any heterogeneity would mean the sample would display variable expression of AF into exogenous fluorochrome channels in a false positive or false negative manner due to incorrect assignment of photons to these fluorochromes (Figure 1B). The third option was first described by Jameson et al. (<span>4</span>) and involves the use of the dimension reduction algorithm OptSNE (<span>9</span>) for best separation of different AF populations, followed by manual gating of each identifiable AF subset. UMAP was also tested and found to be unsuitable for the differentiation of the AF populations. In this issue, Roet et al. (<span>10</span>) outline a method by which the AF characteristics of the sample are first identified by OptSNE for dimension reduction. Using their data (from Flow Repository) I have tested PCA, UMAP, tSNE, and FitSNE and also found that OptSNE was most suitable for the purpose of identifying unique AF populations (unpublished data). They then take the next step in the AF workflow and use Phenograph to automatically cluster each identifiable subset, and a custom R script (Github) to export the events within each gate as its own file (these were then used by SpectroFlo™ software as reference control data files). This technique has the benefit of removing bias from the process of population identification and eliminates manual gating. However, it does require the operator to have access to appropriate third-party software and know how to execute an R-script after first conducting dimensionality reduction and clustering.</p><p>The next challenge in the AF workflow requires that the operator assess the uniqueness of each of the AF signatures to determine their suitability for use in unmixing the data. Roet et al (<span>10</span>) used a Similarity™ Index (SI) threshold ≤0.98, to determine, which AF signatures could be incorporated into the assay for unmixing. They execute this task in a two-step procedure, first by adding the isolated AF signatures as new tags in the fluorochrome library and designing an experiment within SpectroFlo™ software containing each of these new tags to unmix the complete unstained sample (described in more detail in the Data Analysis section of the Materials and Methods portion of their article). During unmixing, SpectroFlo™ software will provide an output of the similarity of each of the AF signatures to one another. Roet et al then executed another R script that derives a ranking of spectra based on similar spectra (SI ≤0.98) and the total SI per cluster, and not unique spectra were eliminated. This script can quickly whittle down what starts as a large list of AF signatures identified in the Phenograph clustering, to just those signatures that are unique, whilst also providing them with a ranking. This does raise the question about the eliminated signatures. If two AF signatures were found to be too similar, and have the same total SI ranking, which AF signature was eliminated? Rules of a good reference control dictate that any reference control should be as bright as, or brighter than any representation of the fluorochrome in the multicolor samples. The total SI ranking system proposed does not take this guidance into consideration, therefore, it is theoretically possible that an AF signature could be selected that does not in fact demonstrate sufficient MFI to correctly unmix all representations of that AF in the mixture. An amendment to the R-script resolved this issue by implementing a final check to ensure that the signature with the highest MFI was selected where 2 signatures of >0.98 SI were identified.</p><p>This part of the AF workflow is the simplest to execute and requires that the operator incorporate the electronic files for the unique AF signatures identified in the previous step as reference controls for unmixing in the multicolor assay. Roet et al. (<span>10</span>) describe the manual method used by many, but it is worth noting that at the time of publication of this commentary, both Cytek® and Sony™ platforms have software tools designed to help the operator identify and incorporate additional AF signatures (Cytek®—Autofluorescence Explorer; Sony™—Autofluorescence Finder). Both tools utilize the method described in Challenge 1, whereby AF is identified in the raw parameter data, and the identified AF signatures are then automatically incorporated into the unmixing, allowing for multiple AF extraction.</p><p>Arguably the most difficult part of the AF workflow, and in fact flow cytometry data analysis in general, is understanding when unmixing errors are present, and if present, what causes them and how they should be resolved. The unbiased method for AF signature identification introduced here by Roet et al. (<span>10</span>) certainly helps the user characterize the heterogeneous AF and decide which signatures are unique, I argue that the process outlined in Roet et al. (<span>10</span>) fig. S2, demonstrating assessment of the correct combination and number of AF signatures to unmix with, requires far more operator skill than each of the steps prior. Assessment of unmixing continues to be a part of the workflow that will vary from operator to operator. The workflow proposed by Roet et al. for AF signature identification and inclusion is certainly a step in the right direction with respect to removing operator bias, but until there is also an unbiased method for identifying the most accurate number and combination of AF signatures to be used in unmixing, as well as an unbiased method to verify unmixing accuracy, a considerable burden of experience and effort is shouldered by the operator. The reason we don't just add every single AF signature is due to the cumulative effect of spillover spreading error when multiple highly overlapping dyes are used. The more AF signatures of high similarity added to an assay, the greater the distortion (diagonal tilt) of the negative population that is observed, which may compromise resolution of some fluorochromes. This is observed in Roet et al. (<span>10</span>) fig. 2A (second row), whereby the CV of the negative population when eight AF signatures were used is greater than the CV of the negative when five AF signatures were used, shown here in more detail in Figure 2. Where this increased spread of the negative coincides with expression of a tertiary marker or poorly separating secondary marker, as is the case with ACKR4 on BV650 in Roet et al. (<span>10</span>), clear determination of positive staining for the marker of interest can be hindered.</p><p>Importantly, the SI of the AF signatures to one another is not the only issue to be aware of here. There are multiple fluorochromes in common usage that bear considerable similarity to many AF signatures found within our samples; fluorochromes such as eflour 450, BUV496, cflour® V547, among many others. When incorporating new AF signatures, the operator should assess the similarity of the AF signatures not just with relation to other AF signatures, but also to exogenous fluorochromes in the assay to clearly understand what the incorporation of new signatures might do to the overall complexity of the assay. The trick is to ensure that AF signatures are added to optimize unmixing and <i>not</i> compromise the resolution of the markers in the assay. Can the unstained sample and multicolor data be leveraged to assess the efficacy of the AF signature choices made by the operator? By taking a measure of the stain index of markers in the presence/absence of different combinations of AF signatures, can a metric of stain index reduction be developed to assist with reducing unmixing assessment bias by indicating which combination(s) of AF signatures result in the best unmixing outcome? Furthermore, can this help with development of guidelines around what degree of stain index reduction is acceptable for a primary, secondary, or tertiary marker?</p><p>Over the last 3 years, considerable advances have been made in this emerging research area of full spectrum AF characterization, with rapid development of multiple workflows, each successively designed to simplify the process and enhance the quality of the data. The data speaks for itself in terms of clarity and resolution of markers that have historically been impeded from clear analysis by autofluorescence. Time and experience will help inform future analysis workflows and a more intimate understanding of AF characteristics of various cell types will improve panel designs for specific AF features with certain markers and fluorochrome combinations.</p><p>One important concept needs to be clearly understood: no amount of multi-AF manipulation can overcome fundamental issues with unmixing driven by unsuitable reference controls. An excellent example of this is shown by Roet et al where they were unable to obtain clean fluorochrome signatures for their single-stained reference controls derived from their biological sample and compensation beads were too dim (Roet et al, <span>10</span>, fig. S4). On the flip side, no amount of reference control optimization will overcome unmixing errors due to under-describing heterogenous cellular autofluorescence. Control optimization and correct implementation of multi-AF signatures must go hand-in-hand. There's no such thing as a free lunch. At this point in our full spectrum autofluorescence journey, the benefits we reap from this analysis pipeline mean that cytometry specialists still need to invest some brain cells in exchange for their beautiful data, but we promise it is worth it.</p><p><b>Katherine R. Pilkington:</b> Conceptualization; writing – original draft; writing – review and editing.</p>","PeriodicalId":11068,"journal":{"name":"Cytometry Part A","volume":"105 8","pages":"563-567"},"PeriodicalIF":2.1000,"publicationDate":"2024-07-10","publicationTypes":"Journal Article","fieldsOfStudy":null,"isOpenAccess":false,"openAccessPdf":"https://onlinelibrary.wiley.com/doi/epdf/10.1002/cyto.a.24885","citationCount":"0","resultStr":"{\"title\":\"Autofluorescence: From burden to benefit\",\"authors\":\"Katherine R. Pilkington\",\"doi\":\"10.1002/cyto.a.24885\",\"DOIUrl\":null,\"url\":null,\"abstract\":\"<p>With the progression from conventional flow cytometry to full spectrum flow cytometry moving as fast as manufacturers create new reagents to expand our fluorochrome palette, a certain factor of flow cytometric analysis continues to appear as a major challenge in data analysis: cellular autofluorescence (AF). More specifically, heterogeneity of cellular AF. The idea of AF in our cytometry assays is not new, one must only search the term “autofluorescence” in this journal to see nearly 1000 publications associated with the subject dating back to the earliest days of publication (<span>1</span>). However, the way we manage and interact with AF in our analysis is evolving at pace with technological advancements and our experimental demands.</p><p>AF is any light emitted from cells by endogenous cellular components that fluoresce. Components like collagen, elastin, tryptophan, NADH, and flavins to name just a few (<span>2</span>), the emission of these components falls predominantly between 400 and 600 nm in mammalian cells. These components, and many others, contribute to the variety of cellular AF found within samples. Cell type, size, granularity, and metabolic state all contribute to variations in AF (<span>2, 3</span>).</p><p>Historically, when encountering a sample with high AF, such as that from an enzymatically digested tissue, one would simply choose red and far-red emitting fluorochromes, thus avoiding the shorter wavelengths most impacted by autofluorescence. In addition, voltages of detectors were often decreased to lower the visual impact of the AF, but this method also dampens the sensitivity of the detector with respect to the intended fluorochrome for analysis. With conventional cytometers and 6–8 parameter assays, this strategy was somewhat effective, but very limiting. The increasing demand to analyze more parameters from each sample means researchers need to embrace new analysis strategies.</p><p>The burden that AF complexity contributes to our assays is easily recognized within our data, but what benefits can we reap if we take the time to optimize our analysis strategies? Without proper care and consideration, data with incorrectly managed heterogeneous AF can result in masking of poorly expressed tertiary markers (<span>4</span>) and even misclassification of cellular phenotypes when AF is incorrectly identified as fluorochrome signal (<span>5</span>). With these potential complications, it is essential to design panels for samples with heterogenous AF to minimize its impact on marker detection and resolution.</p><p>With a spectral flow cytometer, the unique AF properties of different samples can be characterized and leveraged when designing new panels. By thinking of the spectral signature of the AF as just another fluorochrome and implementing good panel design practices with respect to antigen coexpression, fluorochrome brightness, and fluorochrome similarity (<span>6</span>), marker resolution can be substantially improved. This strategy is straightforward for simple sample types with homogeneous AF, such as PBMCs, but challenges arise when dealing with heterogeneous samples, such as from digested tissues and stimulation cultures. In order of appearance in the workflow these challenges are: identification of multiple unique AF signatures, selection of appropriate signatures for incorporation in spectral unmixing, application of those signatures as reference controls in unmixing, and assessment of the unmixing outcome.</p><p>Several recent publications have described workflows and methodologies for maximizing information from samples with high and heterogeneous AF. Peixoto et al. describe identification of different populations of fetal liver cells and analysis of markers in conjunction with individual AF signatures (<span>7</span>). Kharraz et al. described a 16-color panel in mouse skeletal muscle and the subsequent improvement in marker resolution and evaluation, a larger panel than could be achieved without spectral flow cytometry and multiple autofluorescence analysis strategies (<span>5</span>). More recently Jameson et al. described the identification of multiple AF signatures using high-dimensional reduction and the resultant improvement in data resolution when incorporating additional AF signatures (<span>4</span>), importantly, in this instance, without the improvement from the multi-AF workflow, the AF was masking their ability to detect the tdTomato reporter protein.</p><p>When conducting spectral unmixing compared to compensation the intended outcome is the same, we wish to determine the contribution from each fluorochrome in the multicolor mixture. The experiment conducted on the bench is identical, the same single-stained controls are required to delineate the fluorochromes in the assay, but when it comes time to deconvolute, the mathematical calculation itself is different (<span>8</span>). Unmixing uses reference signatures to calculate the contribution from each fluorochrome in a mixture. For accurate determination of the contribution from the exogenous fluorochromes used in the experiment, every source of fluorescence must be referenced, including the endogenous AF.</p><p>The first challenge in data analysis when dealing with samples containing heterogeneous AF is identifying each of the unique AF signatures present within the sample. There are three commonly used methods for this process. First adopted was a method that involves discovery of the unique signatures by analysis of the raw spectral parameter Nx1 or NxN permutations of the unstained sample to identify, which pairing of detectors would discriminate the greatest number of populations, with further segmentation by other parameter pairings if populations remained heterogeneous after this gating method (Figure 1A). The second method is an extrapolation of the first and involves assessment of the <i>unmixed</i> unstained sample where autofluorescence is extracted based on placing a single scatter gate on a population with as discrete a signature as possible, then plotting the AF parameter versus every other fluorochrome in the assay. With this method, any heterogeneity would mean the sample would display variable expression of AF into exogenous fluorochrome channels in a false positive or false negative manner due to incorrect assignment of photons to these fluorochromes (Figure 1B). The third option was first described by Jameson et al. (<span>4</span>) and involves the use of the dimension reduction algorithm OptSNE (<span>9</span>) for best separation of different AF populations, followed by manual gating of each identifiable AF subset. UMAP was also tested and found to be unsuitable for the differentiation of the AF populations. In this issue, Roet et al. (<span>10</span>) outline a method by which the AF characteristics of the sample are first identified by OptSNE for dimension reduction. Using their data (from Flow Repository) I have tested PCA, UMAP, tSNE, and FitSNE and also found that OptSNE was most suitable for the purpose of identifying unique AF populations (unpublished data). They then take the next step in the AF workflow and use Phenograph to automatically cluster each identifiable subset, and a custom R script (Github) to export the events within each gate as its own file (these were then used by SpectroFlo™ software as reference control data files). This technique has the benefit of removing bias from the process of population identification and eliminates manual gating. However, it does require the operator to have access to appropriate third-party software and know how to execute an R-script after first conducting dimensionality reduction and clustering.</p><p>The next challenge in the AF workflow requires that the operator assess the uniqueness of each of the AF signatures to determine their suitability for use in unmixing the data. Roet et al (<span>10</span>) used a Similarity™ Index (SI) threshold ≤0.98, to determine, which AF signatures could be incorporated into the assay for unmixing. They execute this task in a two-step procedure, first by adding the isolated AF signatures as new tags in the fluorochrome library and designing an experiment within SpectroFlo™ software containing each of these new tags to unmix the complete unstained sample (described in more detail in the Data Analysis section of the Materials and Methods portion of their article). During unmixing, SpectroFlo™ software will provide an output of the similarity of each of the AF signatures to one another. Roet et al then executed another R script that derives a ranking of spectra based on similar spectra (SI ≤0.98) and the total SI per cluster, and not unique spectra were eliminated. This script can quickly whittle down what starts as a large list of AF signatures identified in the Phenograph clustering, to just those signatures that are unique, whilst also providing them with a ranking. This does raise the question about the eliminated signatures. If two AF signatures were found to be too similar, and have the same total SI ranking, which AF signature was eliminated? Rules of a good reference control dictate that any reference control should be as bright as, or brighter than any representation of the fluorochrome in the multicolor samples. The total SI ranking system proposed does not take this guidance into consideration, therefore, it is theoretically possible that an AF signature could be selected that does not in fact demonstrate sufficient MFI to correctly unmix all representations of that AF in the mixture. An amendment to the R-script resolved this issue by implementing a final check to ensure that the signature with the highest MFI was selected where 2 signatures of >0.98 SI were identified.</p><p>This part of the AF workflow is the simplest to execute and requires that the operator incorporate the electronic files for the unique AF signatures identified in the previous step as reference controls for unmixing in the multicolor assay. Roet et al. (<span>10</span>) describe the manual method used by many, but it is worth noting that at the time of publication of this commentary, both Cytek® and Sony™ platforms have software tools designed to help the operator identify and incorporate additional AF signatures (Cytek®—Autofluorescence Explorer; Sony™—Autofluorescence Finder). Both tools utilize the method described in Challenge 1, whereby AF is identified in the raw parameter data, and the identified AF signatures are then automatically incorporated into the unmixing, allowing for multiple AF extraction.</p><p>Arguably the most difficult part of the AF workflow, and in fact flow cytometry data analysis in general, is understanding when unmixing errors are present, and if present, what causes them and how they should be resolved. The unbiased method for AF signature identification introduced here by Roet et al. (<span>10</span>) certainly helps the user characterize the heterogeneous AF and decide which signatures are unique, I argue that the process outlined in Roet et al. (<span>10</span>) fig. S2, demonstrating assessment of the correct combination and number of AF signatures to unmix with, requires far more operator skill than each of the steps prior. Assessment of unmixing continues to be a part of the workflow that will vary from operator to operator. The workflow proposed by Roet et al. for AF signature identification and inclusion is certainly a step in the right direction with respect to removing operator bias, but until there is also an unbiased method for identifying the most accurate number and combination of AF signatures to be used in unmixing, as well as an unbiased method to verify unmixing accuracy, a considerable burden of experience and effort is shouldered by the operator. The reason we don't just add every single AF signature is due to the cumulative effect of spillover spreading error when multiple highly overlapping dyes are used. The more AF signatures of high similarity added to an assay, the greater the distortion (diagonal tilt) of the negative population that is observed, which may compromise resolution of some fluorochromes. This is observed in Roet et al. (<span>10</span>) fig. 2A (second row), whereby the CV of the negative population when eight AF signatures were used is greater than the CV of the negative when five AF signatures were used, shown here in more detail in Figure 2. Where this increased spread of the negative coincides with expression of a tertiary marker or poorly separating secondary marker, as is the case with ACKR4 on BV650 in Roet et al. (<span>10</span>), clear determination of positive staining for the marker of interest can be hindered.</p><p>Importantly, the SI of the AF signatures to one another is not the only issue to be aware of here. There are multiple fluorochromes in common usage that bear considerable similarity to many AF signatures found within our samples; fluorochromes such as eflour 450, BUV496, cflour® V547, among many others. When incorporating new AF signatures, the operator should assess the similarity of the AF signatures not just with relation to other AF signatures, but also to exogenous fluorochromes in the assay to clearly understand what the incorporation of new signatures might do to the overall complexity of the assay. The trick is to ensure that AF signatures are added to optimize unmixing and <i>not</i> compromise the resolution of the markers in the assay. Can the unstained sample and multicolor data be leveraged to assess the efficacy of the AF signature choices made by the operator? By taking a measure of the stain index of markers in the presence/absence of different combinations of AF signatures, can a metric of stain index reduction be developed to assist with reducing unmixing assessment bias by indicating which combination(s) of AF signatures result in the best unmixing outcome? Furthermore, can this help with development of guidelines around what degree of stain index reduction is acceptable for a primary, secondary, or tertiary marker?</p><p>Over the last 3 years, considerable advances have been made in this emerging research area of full spectrum AF characterization, with rapid development of multiple workflows, each successively designed to simplify the process and enhance the quality of the data. The data speaks for itself in terms of clarity and resolution of markers that have historically been impeded from clear analysis by autofluorescence. Time and experience will help inform future analysis workflows and a more intimate understanding of AF characteristics of various cell types will improve panel designs for specific AF features with certain markers and fluorochrome combinations.</p><p>One important concept needs to be clearly understood: no amount of multi-AF manipulation can overcome fundamental issues with unmixing driven by unsuitable reference controls. An excellent example of this is shown by Roet et al where they were unable to obtain clean fluorochrome signatures for their single-stained reference controls derived from their biological sample and compensation beads were too dim (Roet et al, <span>10</span>, fig. S4). On the flip side, no amount of reference control optimization will overcome unmixing errors due to under-describing heterogenous cellular autofluorescence. Control optimization and correct implementation of multi-AF signatures must go hand-in-hand. There's no such thing as a free lunch. At this point in our full spectrum autofluorescence journey, the benefits we reap from this analysis pipeline mean that cytometry specialists still need to invest some brain cells in exchange for their beautiful data, but we promise it is worth it.</p><p><b>Katherine R. Pilkington:</b> Conceptualization; writing – original draft; writing – review and editing.</p>\",\"PeriodicalId\":11068,\"journal\":{\"name\":\"Cytometry Part A\",\"volume\":\"105 8\",\"pages\":\"563-567\"},\"PeriodicalIF\":2.1000,\"publicationDate\":\"2024-07-10\",\"publicationTypes\":\"Journal Article\",\"fieldsOfStudy\":null,\"isOpenAccess\":false,\"openAccessPdf\":\"https://onlinelibrary.wiley.com/doi/epdf/10.1002/cyto.a.24885\",\"citationCount\":\"0\",\"resultStr\":null,\"platform\":\"Semanticscholar\",\"paperid\":null,\"PeriodicalName\":\"Cytometry Part A\",\"FirstCategoryId\":\"99\",\"ListUrlMain\":\"https://onlinelibrary.wiley.com/doi/10.1002/cyto.a.24885\",\"RegionNum\":4,\"RegionCategory\":\"生物学\",\"ArticlePicture\":[],\"TitleCN\":null,\"AbstractTextCN\":null,\"PMCID\":null,\"EPubDate\":\"\",\"PubModel\":\"\",\"JCR\":\"Q3\",\"JCRName\":\"BIOCHEMICAL RESEARCH METHODS\",\"Score\":null,\"Total\":0}","platform":"Semanticscholar","paperid":null,"PeriodicalName":"Cytometry Part A","FirstCategoryId":"99","ListUrlMain":"https://onlinelibrary.wiley.com/doi/10.1002/cyto.a.24885","RegionNum":4,"RegionCategory":"生物学","ArticlePicture":[],"TitleCN":null,"AbstractTextCN":null,"PMCID":null,"EPubDate":"","PubModel":"","JCR":"Q3","JCRName":"BIOCHEMICAL RESEARCH METHODS","Score":null,"Total":0}
引用次数: 0
摘要
Roet 等人的研究就是一个很好的例子,他们从生物样本中提取的单染色参考对照无法获得干净的荧光信号,而且补偿珠的颜色太暗(Roet et al, 10, 图 S4)。另一方面,无论如何优化参比对照,都无法克服由于对异质细胞自发荧光描述不足而造成的未混合误差。控制优化和多 AF 签名的正确实施必须齐头并进。天下没有免费的午餐。在我们的全光谱自发荧光之旅中,我们从这一分析管道中获得的好处意味着细胞测量专家仍需要投入一些脑细胞来换取他们的美丽数据,但我们保证这是值得的:构思;写作--原稿;写作--审阅和编辑。
With the progression from conventional flow cytometry to full spectrum flow cytometry moving as fast as manufacturers create new reagents to expand our fluorochrome palette, a certain factor of flow cytometric analysis continues to appear as a major challenge in data analysis: cellular autofluorescence (AF). More specifically, heterogeneity of cellular AF. The idea of AF in our cytometry assays is not new, one must only search the term “autofluorescence” in this journal to see nearly 1000 publications associated with the subject dating back to the earliest days of publication (1). However, the way we manage and interact with AF in our analysis is evolving at pace with technological advancements and our experimental demands.
AF is any light emitted from cells by endogenous cellular components that fluoresce. Components like collagen, elastin, tryptophan, NADH, and flavins to name just a few (2), the emission of these components falls predominantly between 400 and 600 nm in mammalian cells. These components, and many others, contribute to the variety of cellular AF found within samples. Cell type, size, granularity, and metabolic state all contribute to variations in AF (2, 3).
Historically, when encountering a sample with high AF, such as that from an enzymatically digested tissue, one would simply choose red and far-red emitting fluorochromes, thus avoiding the shorter wavelengths most impacted by autofluorescence. In addition, voltages of detectors were often decreased to lower the visual impact of the AF, but this method also dampens the sensitivity of the detector with respect to the intended fluorochrome for analysis. With conventional cytometers and 6–8 parameter assays, this strategy was somewhat effective, but very limiting. The increasing demand to analyze more parameters from each sample means researchers need to embrace new analysis strategies.
The burden that AF complexity contributes to our assays is easily recognized within our data, but what benefits can we reap if we take the time to optimize our analysis strategies? Without proper care and consideration, data with incorrectly managed heterogeneous AF can result in masking of poorly expressed tertiary markers (4) and even misclassification of cellular phenotypes when AF is incorrectly identified as fluorochrome signal (5). With these potential complications, it is essential to design panels for samples with heterogenous AF to minimize its impact on marker detection and resolution.
With a spectral flow cytometer, the unique AF properties of different samples can be characterized and leveraged when designing new panels. By thinking of the spectral signature of the AF as just another fluorochrome and implementing good panel design practices with respect to antigen coexpression, fluorochrome brightness, and fluorochrome similarity (6), marker resolution can be substantially improved. This strategy is straightforward for simple sample types with homogeneous AF, such as PBMCs, but challenges arise when dealing with heterogeneous samples, such as from digested tissues and stimulation cultures. In order of appearance in the workflow these challenges are: identification of multiple unique AF signatures, selection of appropriate signatures for incorporation in spectral unmixing, application of those signatures as reference controls in unmixing, and assessment of the unmixing outcome.
Several recent publications have described workflows and methodologies for maximizing information from samples with high and heterogeneous AF. Peixoto et al. describe identification of different populations of fetal liver cells and analysis of markers in conjunction with individual AF signatures (7). Kharraz et al. described a 16-color panel in mouse skeletal muscle and the subsequent improvement in marker resolution and evaluation, a larger panel than could be achieved without spectral flow cytometry and multiple autofluorescence analysis strategies (5). More recently Jameson et al. described the identification of multiple AF signatures using high-dimensional reduction and the resultant improvement in data resolution when incorporating additional AF signatures (4), importantly, in this instance, without the improvement from the multi-AF workflow, the AF was masking their ability to detect the tdTomato reporter protein.
When conducting spectral unmixing compared to compensation the intended outcome is the same, we wish to determine the contribution from each fluorochrome in the multicolor mixture. The experiment conducted on the bench is identical, the same single-stained controls are required to delineate the fluorochromes in the assay, but when it comes time to deconvolute, the mathematical calculation itself is different (8). Unmixing uses reference signatures to calculate the contribution from each fluorochrome in a mixture. For accurate determination of the contribution from the exogenous fluorochromes used in the experiment, every source of fluorescence must be referenced, including the endogenous AF.
The first challenge in data analysis when dealing with samples containing heterogeneous AF is identifying each of the unique AF signatures present within the sample. There are three commonly used methods for this process. First adopted was a method that involves discovery of the unique signatures by analysis of the raw spectral parameter Nx1 or NxN permutations of the unstained sample to identify, which pairing of detectors would discriminate the greatest number of populations, with further segmentation by other parameter pairings if populations remained heterogeneous after this gating method (Figure 1A). The second method is an extrapolation of the first and involves assessment of the unmixed unstained sample where autofluorescence is extracted based on placing a single scatter gate on a population with as discrete a signature as possible, then plotting the AF parameter versus every other fluorochrome in the assay. With this method, any heterogeneity would mean the sample would display variable expression of AF into exogenous fluorochrome channels in a false positive or false negative manner due to incorrect assignment of photons to these fluorochromes (Figure 1B). The third option was first described by Jameson et al. (4) and involves the use of the dimension reduction algorithm OptSNE (9) for best separation of different AF populations, followed by manual gating of each identifiable AF subset. UMAP was also tested and found to be unsuitable for the differentiation of the AF populations. In this issue, Roet et al. (10) outline a method by which the AF characteristics of the sample are first identified by OptSNE for dimension reduction. Using their data (from Flow Repository) I have tested PCA, UMAP, tSNE, and FitSNE and also found that OptSNE was most suitable for the purpose of identifying unique AF populations (unpublished data). They then take the next step in the AF workflow and use Phenograph to automatically cluster each identifiable subset, and a custom R script (Github) to export the events within each gate as its own file (these were then used by SpectroFlo™ software as reference control data files). This technique has the benefit of removing bias from the process of population identification and eliminates manual gating. However, it does require the operator to have access to appropriate third-party software and know how to execute an R-script after first conducting dimensionality reduction and clustering.
The next challenge in the AF workflow requires that the operator assess the uniqueness of each of the AF signatures to determine their suitability for use in unmixing the data. Roet et al (10) used a Similarity™ Index (SI) threshold ≤0.98, to determine, which AF signatures could be incorporated into the assay for unmixing. They execute this task in a two-step procedure, first by adding the isolated AF signatures as new tags in the fluorochrome library and designing an experiment within SpectroFlo™ software containing each of these new tags to unmix the complete unstained sample (described in more detail in the Data Analysis section of the Materials and Methods portion of their article). During unmixing, SpectroFlo™ software will provide an output of the similarity of each of the AF signatures to one another. Roet et al then executed another R script that derives a ranking of spectra based on similar spectra (SI ≤0.98) and the total SI per cluster, and not unique spectra were eliminated. This script can quickly whittle down what starts as a large list of AF signatures identified in the Phenograph clustering, to just those signatures that are unique, whilst also providing them with a ranking. This does raise the question about the eliminated signatures. If two AF signatures were found to be too similar, and have the same total SI ranking, which AF signature was eliminated? Rules of a good reference control dictate that any reference control should be as bright as, or brighter than any representation of the fluorochrome in the multicolor samples. The total SI ranking system proposed does not take this guidance into consideration, therefore, it is theoretically possible that an AF signature could be selected that does not in fact demonstrate sufficient MFI to correctly unmix all representations of that AF in the mixture. An amendment to the R-script resolved this issue by implementing a final check to ensure that the signature with the highest MFI was selected where 2 signatures of >0.98 SI were identified.
This part of the AF workflow is the simplest to execute and requires that the operator incorporate the electronic files for the unique AF signatures identified in the previous step as reference controls for unmixing in the multicolor assay. Roet et al. (10) describe the manual method used by many, but it is worth noting that at the time of publication of this commentary, both Cytek® and Sony™ platforms have software tools designed to help the operator identify and incorporate additional AF signatures (Cytek®—Autofluorescence Explorer; Sony™—Autofluorescence Finder). Both tools utilize the method described in Challenge 1, whereby AF is identified in the raw parameter data, and the identified AF signatures are then automatically incorporated into the unmixing, allowing for multiple AF extraction.
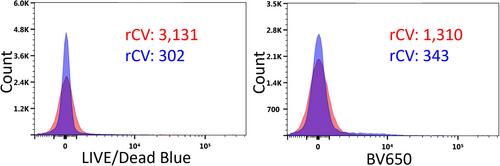
Arguably the most difficult part of the AF workflow, and in fact flow cytometry data analysis in general, is understanding when unmixing errors are present, and if present, what causes them and how they should be resolved. The unbiased method for AF signature identification introduced here by Roet et al. (10) certainly helps the user characterize the heterogeneous AF and decide which signatures are unique, I argue that the process outlined in Roet et al. (10) fig. S2, demonstrating assessment of the correct combination and number of AF signatures to unmix with, requires far more operator skill than each of the steps prior. Assessment of unmixing continues to be a part of the workflow that will vary from operator to operator. The workflow proposed by Roet et al. for AF signature identification and inclusion is certainly a step in the right direction with respect to removing operator bias, but until there is also an unbiased method for identifying the most accurate number and combination of AF signatures to be used in unmixing, as well as an unbiased method to verify unmixing accuracy, a considerable burden of experience and effort is shouldered by the operator. The reason we don't just add every single AF signature is due to the cumulative effect of spillover spreading error when multiple highly overlapping dyes are used. The more AF signatures of high similarity added to an assay, the greater the distortion (diagonal tilt) of the negative population that is observed, which may compromise resolution of some fluorochromes. This is observed in Roet et al. (10) fig. 2A (second row), whereby the CV of the negative population when eight AF signatures were used is greater than the CV of the negative when five AF signatures were used, shown here in more detail in Figure 2. Where this increased spread of the negative coincides with expression of a tertiary marker or poorly separating secondary marker, as is the case with ACKR4 on BV650 in Roet et al. (10), clear determination of positive staining for the marker of interest can be hindered.
Importantly, the SI of the AF signatures to one another is not the only issue to be aware of here. There are multiple fluorochromes in common usage that bear considerable similarity to many AF signatures found within our samples; fluorochromes such as eflour 450, BUV496, cflour® V547, among many others. When incorporating new AF signatures, the operator should assess the similarity of the AF signatures not just with relation to other AF signatures, but also to exogenous fluorochromes in the assay to clearly understand what the incorporation of new signatures might do to the overall complexity of the assay. The trick is to ensure that AF signatures are added to optimize unmixing and not compromise the resolution of the markers in the assay. Can the unstained sample and multicolor data be leveraged to assess the efficacy of the AF signature choices made by the operator? By taking a measure of the stain index of markers in the presence/absence of different combinations of AF signatures, can a metric of stain index reduction be developed to assist with reducing unmixing assessment bias by indicating which combination(s) of AF signatures result in the best unmixing outcome? Furthermore, can this help with development of guidelines around what degree of stain index reduction is acceptable for a primary, secondary, or tertiary marker?
Over the last 3 years, considerable advances have been made in this emerging research area of full spectrum AF characterization, with rapid development of multiple workflows, each successively designed to simplify the process and enhance the quality of the data. The data speaks for itself in terms of clarity and resolution of markers that have historically been impeded from clear analysis by autofluorescence. Time and experience will help inform future analysis workflows and a more intimate understanding of AF characteristics of various cell types will improve panel designs for specific AF features with certain markers and fluorochrome combinations.
One important concept needs to be clearly understood: no amount of multi-AF manipulation can overcome fundamental issues with unmixing driven by unsuitable reference controls. An excellent example of this is shown by Roet et al where they were unable to obtain clean fluorochrome signatures for their single-stained reference controls derived from their biological sample and compensation beads were too dim (Roet et al, 10, fig. S4). On the flip side, no amount of reference control optimization will overcome unmixing errors due to under-describing heterogenous cellular autofluorescence. Control optimization and correct implementation of multi-AF signatures must go hand-in-hand. There's no such thing as a free lunch. At this point in our full spectrum autofluorescence journey, the benefits we reap from this analysis pipeline mean that cytometry specialists still need to invest some brain cells in exchange for their beautiful data, but we promise it is worth it.
Katherine R. Pilkington: Conceptualization; writing – original draft; writing – review and editing.
期刊介绍:
Cytometry Part A, the journal of quantitative single-cell analysis, features original research reports and reviews of innovative scientific studies employing quantitative single-cell measurement, separation, manipulation, and modeling techniques, as well as original articles on mechanisms of molecular and cellular functions obtained by cytometry techniques.
The journal welcomes submissions from multiple research fields that fully embrace the study of the cytome:
Biomedical Instrumentation Engineering
Biophotonics
Bioinformatics
Cell Biology
Computational Biology
Data Science
Immunology
Parasitology
Microbiology
Neuroscience
Cancer
Stem Cells
Tissue Regeneration.
 求助内容:
求助内容: 应助结果提醒方式:


