{"title":"评估单例数据中的非重叠性:优势、挑战和建议","authors":"Rumen Manolov, René Tanious","doi":"10.1007/s10864-024-09552-w","DOIUrl":null,"url":null,"abstract":"<p>Overlap is one of the data aspects that are expected to be assessed when visually inspecting single-case experimental designs (SCED) data. A frequently used quantification of overlap is the Nonoverlap of All Pairs (NAP). The current article reviews the main strengths and challenges when using this index, as compared to other nonoverlap indices such as Tau and the Percentage of data points exceeding the median. Four challenges are reviewed: the difficulty in representing NAP graphically, the presence of a ceiling effect, the disregard of trend, and the limitations in using <i>p</i>-values associated with NAP. Given the importance of complementing quantitative analysis and visual inspection of graphed data, straightforward quantifications and new graphical elements for the time-series plot are proposed as options for addressing the first three challenges. The suggestions for graphical representations (representing within-phase monotonic trend and across-phases overlaps) and additional numerical summaries (quantifying the degree of separation in case of complete nonoverlap or the proportion of data points in the overlap zone) are illustrated with two multiple-baseline data sets. To make it easier to obtain the plots and quantifications, the recommendations are implemented in a freely available user-friendly website. Educational researchers can use this article to inform their use and application of NAP to meaningfully interpret this quantification in the context of SCEDs.</p>","PeriodicalId":47391,"journal":{"name":"Journal of Behavioral Education","volume":"342 1","pages":""},"PeriodicalIF":1.2000,"publicationDate":"2024-06-19","publicationTypes":"Journal Article","fieldsOfStudy":null,"isOpenAccess":false,"openAccessPdf":"","citationCount":"0","resultStr":"{\"title\":\"Assessing Nonoverlap in Single-Case Data: Strengths, Challenges, and Recommendations\",\"authors\":\"Rumen Manolov, René Tanious\",\"doi\":\"10.1007/s10864-024-09552-w\",\"DOIUrl\":null,\"url\":null,\"abstract\":\"<p>Overlap is one of the data aspects that are expected to be assessed when visually inspecting single-case experimental designs (SCED) data. A frequently used quantification of overlap is the Nonoverlap of All Pairs (NAP). The current article reviews the main strengths and challenges when using this index, as compared to other nonoverlap indices such as Tau and the Percentage of data points exceeding the median. Four challenges are reviewed: the difficulty in representing NAP graphically, the presence of a ceiling effect, the disregard of trend, and the limitations in using <i>p</i>-values associated with NAP. Given the importance of complementing quantitative analysis and visual inspection of graphed data, straightforward quantifications and new graphical elements for the time-series plot are proposed as options for addressing the first three challenges. The suggestions for graphical representations (representing within-phase monotonic trend and across-phases overlaps) and additional numerical summaries (quantifying the degree of separation in case of complete nonoverlap or the proportion of data points in the overlap zone) are illustrated with two multiple-baseline data sets. To make it easier to obtain the plots and quantifications, the recommendations are implemented in a freely available user-friendly website. Educational researchers can use this article to inform their use and application of NAP to meaningfully interpret this quantification in the context of SCEDs.</p>\",\"PeriodicalId\":47391,\"journal\":{\"name\":\"Journal of Behavioral Education\",\"volume\":\"342 1\",\"pages\":\"\"},\"PeriodicalIF\":1.2000,\"publicationDate\":\"2024-06-19\",\"publicationTypes\":\"Journal Article\",\"fieldsOfStudy\":null,\"isOpenAccess\":false,\"openAccessPdf\":\"\",\"citationCount\":\"0\",\"resultStr\":null,\"platform\":\"Semanticscholar\",\"paperid\":null,\"PeriodicalName\":\"Journal of Behavioral Education\",\"FirstCategoryId\":\"95\",\"ListUrlMain\":\"https://doi.org/10.1007/s10864-024-09552-w\",\"RegionNum\":4,\"RegionCategory\":\"教育学\",\"ArticlePicture\":[],\"TitleCN\":null,\"AbstractTextCN\":null,\"PMCID\":null,\"EPubDate\":\"\",\"PubModel\":\"\",\"JCR\":\"Q3\",\"JCRName\":\"EDUCATION, SPECIAL\",\"Score\":null,\"Total\":0}","platform":"Semanticscholar","paperid":null,"PeriodicalName":"Journal of Behavioral Education","FirstCategoryId":"95","ListUrlMain":"https://doi.org/10.1007/s10864-024-09552-w","RegionNum":4,"RegionCategory":"教育学","ArticlePicture":[],"TitleCN":null,"AbstractTextCN":null,"PMCID":null,"EPubDate":"","PubModel":"","JCR":"Q3","JCRName":"EDUCATION, SPECIAL","Score":null,"Total":0}
引用次数: 0
摘要
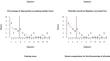
重叠是目测单例实验设计(SCED)数据时需要评估的数据方面之一。经常使用的重叠量化指标是 "全对非重叠"(NAP)。与 Tau 和超过中位数的数据点百分比等其他非重叠指数相比,本文回顾了使用该指数的主要优势和挑战。文章回顾了四个挑战:用图形表示非重叠指数的困难、天花板效应的存在、趋势的忽略以及使用与非重叠指数相关的 p 值的局限性。考虑到定量分析与图表数据目测互补的重要性,提出了直接量化和时间序列图的新图表元素,作为应对前三个挑战的备选方案。建议的图形表示方法(表示阶段内单调趋势和跨阶段重叠)和额外的数字总结(量化完全不重叠情况下的分离程度或重叠区域中的数据点比例)通过两个多基线数据集进行说明。为了更方便地获取图表和量化数据,我们在一个用户友好型网站上免费提供了这些建议。教育研究人员可以利用这篇文章为他们使用和应用 NAP 提供信息,以便在 SCED 的背景下有意义地解释这种量化。
Assessing Nonoverlap in Single-Case Data: Strengths, Challenges, and Recommendations
Overlap is one of the data aspects that are expected to be assessed when visually inspecting single-case experimental designs (SCED) data. A frequently used quantification of overlap is the Nonoverlap of All Pairs (NAP). The current article reviews the main strengths and challenges when using this index, as compared to other nonoverlap indices such as Tau and the Percentage of data points exceeding the median. Four challenges are reviewed: the difficulty in representing NAP graphically, the presence of a ceiling effect, the disregard of trend, and the limitations in using p-values associated with NAP. Given the importance of complementing quantitative analysis and visual inspection of graphed data, straightforward quantifications and new graphical elements for the time-series plot are proposed as options for addressing the first three challenges. The suggestions for graphical representations (representing within-phase monotonic trend and across-phases overlaps) and additional numerical summaries (quantifying the degree of separation in case of complete nonoverlap or the proportion of data points in the overlap zone) are illustrated with two multiple-baseline data sets. To make it easier to obtain the plots and quantifications, the recommendations are implemented in a freely available user-friendly website. Educational researchers can use this article to inform their use and application of NAP to meaningfully interpret this quantification in the context of SCEDs.
期刊介绍:
The Journal of Behavioral Education is an international forum dedicated to publishing original research papers on the application of behavioral principles and technology to education. Education is defined broadly and the journal places no restriction on the types of participants involved in the reported studies--including by age, ability, or setting. Each quarterly issue presents empirical research investigating best-practices and innovative methods to address a wide range of educational targets and issues pertaining to the needs of diverse learners and to implementation. The Journal of Behavioral Education is a peer-reviewed scholarly journal whose target audience is educational researchers and practitioners including general and special education teachers, school psychologists, and other school personnel. Rigorous experimental designs, including single-subject with replication and group designs are considered for publication. An emphasis is placed on direct observation measures of the primary dependent variable in studies of educational issues, problems, and practices. Discussion articles and critical reviews also are published.
 求助内容:
求助内容: 应助结果提醒方式:


