Benjamin Dechant , Jens Kattge , Ryan Pavlick , Fabian D. Schneider , Francesco M. Sabatini , Álvaro Moreno-Martínez , Ethan E. Butler , Peter M. van Bodegom , Helena Vallicrosa , Teja Kattenborn , Coline C.F. Boonman , Nima Madani , Ian J. Wright , Ning Dong , Hannes Feilhauer , Josep Peñuelas , Jordi Sardans , Jesús Aguirre-Gutiérrez , Peter B. Reich , Pedro J. Leitão , Philip A. Townsend
{"title":"全球叶片性状图的相互比较揭示了放大方法的根本差异和局限性","authors":"Benjamin Dechant , Jens Kattge , Ryan Pavlick , Fabian D. Schneider , Francesco M. Sabatini , Álvaro Moreno-Martínez , Ethan E. Butler , Peter M. van Bodegom , Helena Vallicrosa , Teja Kattenborn , Coline C.F. Boonman , Nima Madani , Ian J. Wright , Ning Dong , Hannes Feilhauer , Josep Peñuelas , Jordi Sardans , Jesús Aguirre-Gutiérrez , Peter B. Reich , Pedro J. Leitão , Philip A. Townsend","doi":"10.1016/j.rse.2024.114276","DOIUrl":null,"url":null,"abstract":"<div><p>Foliar traits such as specific leaf area (SLA), leaf nitrogen (N), and phosphorus (P) concentrations play important roles in plant economic strategies and ecosystem functioning. Various global maps of these foliar traits have been generated using statistical upscaling approaches based on in-situ trait observations. Here, we intercompare such global upscaled foliar trait maps at 0.5° spatial resolution (six maps for SLA, five for N, three for P), categorize the upscaling approaches used to generate them, and evaluate the maps with trait estimates from a global database of vegetation plots (sPlotOpen). We disentangled the contributions from different plant functional types (PFTs) to the upscaled maps and quantified the impacts of using different plot-level trait metrics on the evaluation with sPlotOpen: community weighted mean (CWM) and top-of-canopy weighted mean (TWM). We found that the global foliar trait maps of SLA and N differ drastically and fall into two groups that are almost uncorrelated (for P only maps from one group were available). The primary factor explaining the differences between these groups is the use of PFT information combined with remote sensing-derived land cover products in one group while the other group mostly relied on environmental predictors alone. The maps that used PFT and corresponding land cover information exhibit considerable similarities in spatial patterns that are strongly driven by land cover. The maps not using PFTs show a lower level of similarity and tend to be strongly driven by individual environmental variables. Upscaled maps of both groups were moderately correlated to sPlotOpen data aggregated to the grid-cell level (<em>R</em> = 0.2–0.6) when processing sPlotOpen in a way that is consistent with the respective trait upscaling approaches, including the plot-level trait metric (CWM or TWM) and the scaling to the grid cells with or without accounting for fractional land cover. The impact of using TWM or CWM was relevant, but considerably smaller than that of the PFT and land cover information. The maps using PFT and land cover information better reproduce the between-PFT trait differences of sPlotOpen data, while the two groups performed similarly in capturing within-PFT trait variation.</p><p>Our findings highlight the importance of explicitly accounting for within-grid-cell trait variation, which has important implications for applications using existing maps and future upscaling efforts. Remote sensing information has great potential to reduce uncertainties related to scaling from in-situ observations to grid cells and the regression-based mapping steps involved in the upscaling.</p></div>","PeriodicalId":417,"journal":{"name":"Remote Sensing of Environment","volume":null,"pages":null},"PeriodicalIF":11.1000,"publicationDate":"2024-06-27","publicationTypes":"Journal Article","fieldsOfStudy":null,"isOpenAccess":false,"openAccessPdf":"https://www.sciencedirect.com/science/article/pii/S0034425724002943/pdfft?md5=0f27a8fef425c225d908b59739984013&pid=1-s2.0-S0034425724002943-main.pdf","citationCount":"0","resultStr":"{\"title\":\"Intercomparison of global foliar trait maps reveals fundamental differences and limitations of upscaling approaches\",\"authors\":\"Benjamin Dechant , Jens Kattge , Ryan Pavlick , Fabian D. Schneider , Francesco M. Sabatini , Álvaro Moreno-Martínez , Ethan E. Butler , Peter M. van Bodegom , Helena Vallicrosa , Teja Kattenborn , Coline C.F. Boonman , Nima Madani , Ian J. Wright , Ning Dong , Hannes Feilhauer , Josep Peñuelas , Jordi Sardans , Jesús Aguirre-Gutiérrez , Peter B. Reich , Pedro J. Leitão , Philip A. Townsend\",\"doi\":\"10.1016/j.rse.2024.114276\",\"DOIUrl\":null,\"url\":null,\"abstract\":\"<div><p>Foliar traits such as specific leaf area (SLA), leaf nitrogen (N), and phosphorus (P) concentrations play important roles in plant economic strategies and ecosystem functioning. Various global maps of these foliar traits have been generated using statistical upscaling approaches based on in-situ trait observations. Here, we intercompare such global upscaled foliar trait maps at 0.5° spatial resolution (six maps for SLA, five for N, three for P), categorize the upscaling approaches used to generate them, and evaluate the maps with trait estimates from a global database of vegetation plots (sPlotOpen). We disentangled the contributions from different plant functional types (PFTs) to the upscaled maps and quantified the impacts of using different plot-level trait metrics on the evaluation with sPlotOpen: community weighted mean (CWM) and top-of-canopy weighted mean (TWM). We found that the global foliar trait maps of SLA and N differ drastically and fall into two groups that are almost uncorrelated (for P only maps from one group were available). The primary factor explaining the differences between these groups is the use of PFT information combined with remote sensing-derived land cover products in one group while the other group mostly relied on environmental predictors alone. The maps that used PFT and corresponding land cover information exhibit considerable similarities in spatial patterns that are strongly driven by land cover. The maps not using PFTs show a lower level of similarity and tend to be strongly driven by individual environmental variables. Upscaled maps of both groups were moderately correlated to sPlotOpen data aggregated to the grid-cell level (<em>R</em> = 0.2–0.6) when processing sPlotOpen in a way that is consistent with the respective trait upscaling approaches, including the plot-level trait metric (CWM or TWM) and the scaling to the grid cells with or without accounting for fractional land cover. The impact of using TWM or CWM was relevant, but considerably smaller than that of the PFT and land cover information. The maps using PFT and land cover information better reproduce the between-PFT trait differences of sPlotOpen data, while the two groups performed similarly in capturing within-PFT trait variation.</p><p>Our findings highlight the importance of explicitly accounting for within-grid-cell trait variation, which has important implications for applications using existing maps and future upscaling efforts. Remote sensing information has great potential to reduce uncertainties related to scaling from in-situ observations to grid cells and the regression-based mapping steps involved in the upscaling.</p></div>\",\"PeriodicalId\":417,\"journal\":{\"name\":\"Remote Sensing of Environment\",\"volume\":null,\"pages\":null},\"PeriodicalIF\":11.1000,\"publicationDate\":\"2024-06-27\",\"publicationTypes\":\"Journal Article\",\"fieldsOfStudy\":null,\"isOpenAccess\":false,\"openAccessPdf\":\"https://www.sciencedirect.com/science/article/pii/S0034425724002943/pdfft?md5=0f27a8fef425c225d908b59739984013&pid=1-s2.0-S0034425724002943-main.pdf\",\"citationCount\":\"0\",\"resultStr\":null,\"platform\":\"Semanticscholar\",\"paperid\":null,\"PeriodicalName\":\"Remote Sensing of Environment\",\"FirstCategoryId\":\"5\",\"ListUrlMain\":\"https://www.sciencedirect.com/science/article/pii/S0034425724002943\",\"RegionNum\":1,\"RegionCategory\":\"地球科学\",\"ArticlePicture\":[],\"TitleCN\":null,\"AbstractTextCN\":null,\"PMCID\":null,\"EPubDate\":\"\",\"PubModel\":\"\",\"JCR\":\"Q1\",\"JCRName\":\"ENVIRONMENTAL SCIENCES\",\"Score\":null,\"Total\":0}","platform":"Semanticscholar","paperid":null,"PeriodicalName":"Remote Sensing of Environment","FirstCategoryId":"5","ListUrlMain":"https://www.sciencedirect.com/science/article/pii/S0034425724002943","RegionNum":1,"RegionCategory":"地球科学","ArticlePicture":[],"TitleCN":null,"AbstractTextCN":null,"PMCID":null,"EPubDate":"","PubModel":"","JCR":"Q1","JCRName":"ENVIRONMENTAL SCIENCES","Score":null,"Total":0}
Intercomparison of global foliar trait maps reveals fundamental differences and limitations of upscaling approaches
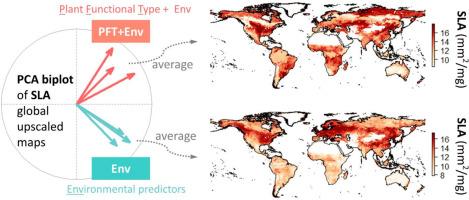
Foliar traits such as specific leaf area (SLA), leaf nitrogen (N), and phosphorus (P) concentrations play important roles in plant economic strategies and ecosystem functioning. Various global maps of these foliar traits have been generated using statistical upscaling approaches based on in-situ trait observations. Here, we intercompare such global upscaled foliar trait maps at 0.5° spatial resolution (six maps for SLA, five for N, three for P), categorize the upscaling approaches used to generate them, and evaluate the maps with trait estimates from a global database of vegetation plots (sPlotOpen). We disentangled the contributions from different plant functional types (PFTs) to the upscaled maps and quantified the impacts of using different plot-level trait metrics on the evaluation with sPlotOpen: community weighted mean (CWM) and top-of-canopy weighted mean (TWM). We found that the global foliar trait maps of SLA and N differ drastically and fall into two groups that are almost uncorrelated (for P only maps from one group were available). The primary factor explaining the differences between these groups is the use of PFT information combined with remote sensing-derived land cover products in one group while the other group mostly relied on environmental predictors alone. The maps that used PFT and corresponding land cover information exhibit considerable similarities in spatial patterns that are strongly driven by land cover. The maps not using PFTs show a lower level of similarity and tend to be strongly driven by individual environmental variables. Upscaled maps of both groups were moderately correlated to sPlotOpen data aggregated to the grid-cell level (R = 0.2–0.6) when processing sPlotOpen in a way that is consistent with the respective trait upscaling approaches, including the plot-level trait metric (CWM or TWM) and the scaling to the grid cells with or without accounting for fractional land cover. The impact of using TWM or CWM was relevant, but considerably smaller than that of the PFT and land cover information. The maps using PFT and land cover information better reproduce the between-PFT trait differences of sPlotOpen data, while the two groups performed similarly in capturing within-PFT trait variation.
Our findings highlight the importance of explicitly accounting for within-grid-cell trait variation, which has important implications for applications using existing maps and future upscaling efforts. Remote sensing information has great potential to reduce uncertainties related to scaling from in-situ observations to grid cells and the regression-based mapping steps involved in the upscaling.
期刊介绍:
Remote Sensing of Environment (RSE) serves the Earth observation community by disseminating results on the theory, science, applications, and technology that contribute to advancing the field of remote sensing. With a thoroughly interdisciplinary approach, RSE encompasses terrestrial, oceanic, and atmospheric sensing.
The journal emphasizes biophysical and quantitative approaches to remote sensing at local to global scales, covering a diverse range of applications and techniques.
RSE serves as a vital platform for the exchange of knowledge and advancements in the dynamic field of remote sensing.

 求助内容:
求助内容: 应助结果提醒方式:


