{"title":"利用动画线性投影探索非线性模型的局部解释","authors":"Nicholas Spyrison, Dianne Cook, Przemyslaw Biecek","doi":"10.1007/s00180-023-01453-2","DOIUrl":null,"url":null,"abstract":"<p>The increased predictive power of machine learning models comes at the cost of increased complexity and loss of interpretability, particularly in comparison to parametric statistical models. This trade-off has led to the emergence of eXplainable AI (XAI) which provides methods, such as local explanations (LEs) and local variable attributions (LVAs), to shed light on how a model use predictors to arrive at a prediction. These provide a point estimate of the linear variable importance in the vicinity of a single observation. However, LVAs tend not to effectively handle association between predictors. To understand how the interaction between predictors affects the variable importance estimate, we can convert LVAs into linear projections and use the radial tour. This is also useful for learning how a model has made a mistake, or the effect of outliers, or the clustering of observations. The approach is illustrated with examples from categorical (penguin species, chocolate types) and quantitative (soccer/football salaries, house prices) response models. The methods are implemented in the R package cheem, available on CRAN.</p>","PeriodicalId":55223,"journal":{"name":"Computational Statistics","volume":"12 1","pages":""},"PeriodicalIF":1.4000,"publicationDate":"2024-01-31","publicationTypes":"Journal Article","fieldsOfStudy":null,"isOpenAccess":false,"openAccessPdf":"","citationCount":"0","resultStr":"{\"title\":\"Exploring local explanations of nonlinear models using animated linear projections\",\"authors\":\"Nicholas Spyrison, Dianne Cook, Przemyslaw Biecek\",\"doi\":\"10.1007/s00180-023-01453-2\",\"DOIUrl\":null,\"url\":null,\"abstract\":\"<p>The increased predictive power of machine learning models comes at the cost of increased complexity and loss of interpretability, particularly in comparison to parametric statistical models. This trade-off has led to the emergence of eXplainable AI (XAI) which provides methods, such as local explanations (LEs) and local variable attributions (LVAs), to shed light on how a model use predictors to arrive at a prediction. These provide a point estimate of the linear variable importance in the vicinity of a single observation. However, LVAs tend not to effectively handle association between predictors. To understand how the interaction between predictors affects the variable importance estimate, we can convert LVAs into linear projections and use the radial tour. This is also useful for learning how a model has made a mistake, or the effect of outliers, or the clustering of observations. The approach is illustrated with examples from categorical (penguin species, chocolate types) and quantitative (soccer/football salaries, house prices) response models. The methods are implemented in the R package cheem, available on CRAN.</p>\",\"PeriodicalId\":55223,\"journal\":{\"name\":\"Computational Statistics\",\"volume\":\"12 1\",\"pages\":\"\"},\"PeriodicalIF\":1.4000,\"publicationDate\":\"2024-01-31\",\"publicationTypes\":\"Journal Article\",\"fieldsOfStudy\":null,\"isOpenAccess\":false,\"openAccessPdf\":\"\",\"citationCount\":\"0\",\"resultStr\":null,\"platform\":\"Semanticscholar\",\"paperid\":null,\"PeriodicalName\":\"Computational Statistics\",\"FirstCategoryId\":\"100\",\"ListUrlMain\":\"https://doi.org/10.1007/s00180-023-01453-2\",\"RegionNum\":4,\"RegionCategory\":\"数学\",\"ArticlePicture\":[],\"TitleCN\":null,\"AbstractTextCN\":null,\"PMCID\":null,\"EPubDate\":\"\",\"PubModel\":\"\",\"JCR\":\"Q3\",\"JCRName\":\"STATISTICS & PROBABILITY\",\"Score\":null,\"Total\":0}","platform":"Semanticscholar","paperid":null,"PeriodicalName":"Computational Statistics","FirstCategoryId":"100","ListUrlMain":"https://doi.org/10.1007/s00180-023-01453-2","RegionNum":4,"RegionCategory":"数学","ArticlePicture":[],"TitleCN":null,"AbstractTextCN":null,"PMCID":null,"EPubDate":"","PubModel":"","JCR":"Q3","JCRName":"STATISTICS & PROBABILITY","Score":null,"Total":0}
引用次数: 0
摘要
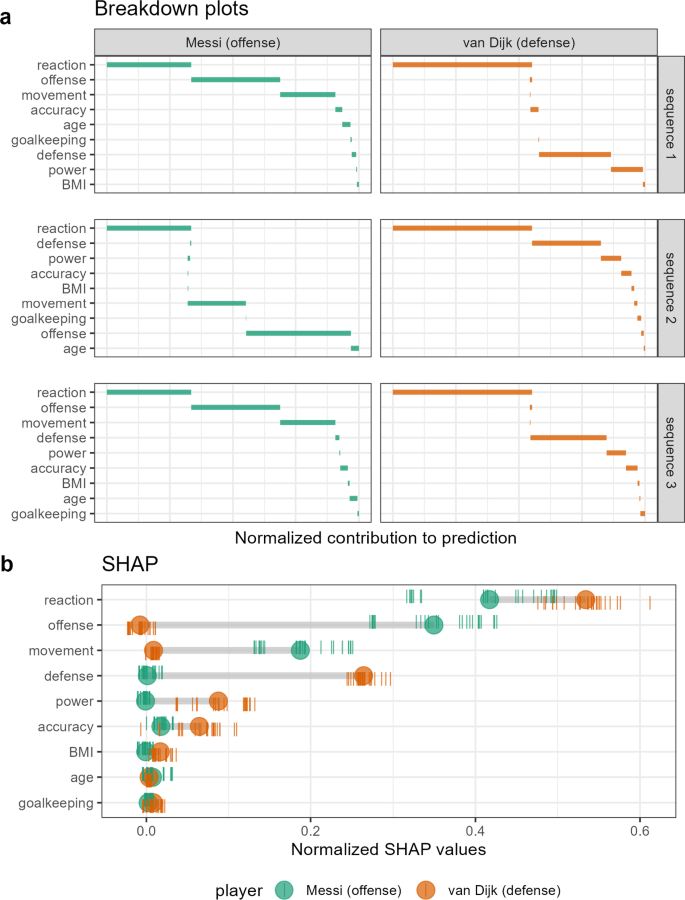
机器学习模型预测能力的提高是以复杂性的增加和可解释性的丧失为代价的,尤其是与参数统计模型相比。这种权衡导致了可解释人工智能(XAI)的出现,它提供了一些方法,如局部解释(LE)和局部变量归因(LVA),以揭示模型是如何利用预测因子得出预测结果的。这些方法提供了对单个观测值附近线性变量重要性的点估计。然而,线性变量归因往往不能有效地处理预测因子之间的关联。为了了解预测因子之间的交互作用如何影响变量重要性估计值,我们可以将 LVA 转换为线性投影并使用径向游程。这对于了解模型如何出错、异常值的影响或观察结果的聚类也很有用。我们以分类(企鹅种类、巧克力类型)和定量(足球/橄榄球工资、房价)响应模型为例,对该方法进行了说明。这些方法在 CRAN 上提供的 R 软件包 cheem 中实现。
Exploring local explanations of nonlinear models using animated linear projections
The increased predictive power of machine learning models comes at the cost of increased complexity and loss of interpretability, particularly in comparison to parametric statistical models. This trade-off has led to the emergence of eXplainable AI (XAI) which provides methods, such as local explanations (LEs) and local variable attributions (LVAs), to shed light on how a model use predictors to arrive at a prediction. These provide a point estimate of the linear variable importance in the vicinity of a single observation. However, LVAs tend not to effectively handle association between predictors. To understand how the interaction between predictors affects the variable importance estimate, we can convert LVAs into linear projections and use the radial tour. This is also useful for learning how a model has made a mistake, or the effect of outliers, or the clustering of observations. The approach is illustrated with examples from categorical (penguin species, chocolate types) and quantitative (soccer/football salaries, house prices) response models. The methods are implemented in the R package cheem, available on CRAN.
期刊介绍:
Computational Statistics (CompStat) is an international journal which promotes the publication of applications and methodological research in the field of Computational Statistics. The focus of papers in CompStat is on the contribution to and influence of computing on statistics and vice versa. The journal provides a forum for computer scientists, mathematicians, and statisticians in a variety of fields of statistics such as biometrics, econometrics, data analysis, graphics, simulation, algorithms, knowledge based systems, and Bayesian computing. CompStat publishes hardware, software plus package reports.
 求助内容:
求助内容: 应助结果提醒方式:


