{"title":"毕业生运输现象的数字可视化","authors":"Michael Rother","doi":"10.1002/cae.22709","DOIUrl":null,"url":null,"abstract":"<p>The use of contour flood plots and color digital movies is investigated for teaching fluid mechanics, heat transfer, and mass transfer at the first-year graduate student level. The color visualizations are intended to not only stimulate curiosity but also encourage enthusiasm and determination in learning difficult material. Although there is a significant amount of finite-difference material, the focus is on analytical solutions. In particular, the mathematical problems involve error functions and Fourier series, which generally prove uninteresting and unpopular. Students are encouraged to produce the visualizations themselves, in addition to being provided with digital results in various forms. Excel can be used to generate both the analytical and finite difference calculations, but Python or another computer language can be employed. While software, such as Matplotlib with Python, Gnuplot, or Tecplot, can create excellent contour flood plots, results from Excel are also good, and Powerpoint will produce movies from individual frames. Student response is positive, although quantifying their reaction is difficult based on the small class sizes. Not surprisingly, the use of color appeals to students and adds to their interest. In addition, students claim increased understanding with contour plots and movies, but the visualizations should be used in conjunction with more traditional graphs, perhaps augmented with consistent use of color. However, the impact on motivation due to color presentation is harder to establish. Interestingly, both graduate and senior undergraduate students showed about equal preference for the rainbow and viridis color palettes.</p>","PeriodicalId":50643,"journal":{"name":"Computer Applications in Engineering Education","volume":"32 2","pages":""},"PeriodicalIF":2.0000,"publicationDate":"2024-01-03","publicationTypes":"Journal Article","fieldsOfStudy":null,"isOpenAccess":false,"openAccessPdf":"https://onlinelibrary.wiley.com/doi/epdf/10.1002/cae.22709","citationCount":"0","resultStr":"{\"title\":\"Digital visualization in graduate transport phenomena\",\"authors\":\"Michael Rother\",\"doi\":\"10.1002/cae.22709\",\"DOIUrl\":null,\"url\":null,\"abstract\":\"<p>The use of contour flood plots and color digital movies is investigated for teaching fluid mechanics, heat transfer, and mass transfer at the first-year graduate student level. The color visualizations are intended to not only stimulate curiosity but also encourage enthusiasm and determination in learning difficult material. Although there is a significant amount of finite-difference material, the focus is on analytical solutions. In particular, the mathematical problems involve error functions and Fourier series, which generally prove uninteresting and unpopular. Students are encouraged to produce the visualizations themselves, in addition to being provided with digital results in various forms. Excel can be used to generate both the analytical and finite difference calculations, but Python or another computer language can be employed. While software, such as Matplotlib with Python, Gnuplot, or Tecplot, can create excellent contour flood plots, results from Excel are also good, and Powerpoint will produce movies from individual frames. Student response is positive, although quantifying their reaction is difficult based on the small class sizes. Not surprisingly, the use of color appeals to students and adds to their interest. In addition, students claim increased understanding with contour plots and movies, but the visualizations should be used in conjunction with more traditional graphs, perhaps augmented with consistent use of color. However, the impact on motivation due to color presentation is harder to establish. Interestingly, both graduate and senior undergraduate students showed about equal preference for the rainbow and viridis color palettes.</p>\",\"PeriodicalId\":50643,\"journal\":{\"name\":\"Computer Applications in Engineering Education\",\"volume\":\"32 2\",\"pages\":\"\"},\"PeriodicalIF\":2.0000,\"publicationDate\":\"2024-01-03\",\"publicationTypes\":\"Journal Article\",\"fieldsOfStudy\":null,\"isOpenAccess\":false,\"openAccessPdf\":\"https://onlinelibrary.wiley.com/doi/epdf/10.1002/cae.22709\",\"citationCount\":\"0\",\"resultStr\":null,\"platform\":\"Semanticscholar\",\"paperid\":null,\"PeriodicalName\":\"Computer Applications in Engineering Education\",\"FirstCategoryId\":\"5\",\"ListUrlMain\":\"https://onlinelibrary.wiley.com/doi/10.1002/cae.22709\",\"RegionNum\":3,\"RegionCategory\":\"工程技术\",\"ArticlePicture\":[],\"TitleCN\":null,\"AbstractTextCN\":null,\"PMCID\":null,\"EPubDate\":\"\",\"PubModel\":\"\",\"JCR\":\"Q3\",\"JCRName\":\"COMPUTER SCIENCE, INTERDISCIPLINARY APPLICATIONS\",\"Score\":null,\"Total\":0}","platform":"Semanticscholar","paperid":null,"PeriodicalName":"Computer Applications in Engineering Education","FirstCategoryId":"5","ListUrlMain":"https://onlinelibrary.wiley.com/doi/10.1002/cae.22709","RegionNum":3,"RegionCategory":"工程技术","ArticlePicture":[],"TitleCN":null,"AbstractTextCN":null,"PMCID":null,"EPubDate":"","PubModel":"","JCR":"Q3","JCRName":"COMPUTER SCIENCE, INTERDISCIPLINARY APPLICATIONS","Score":null,"Total":0}
Digital visualization in graduate transport phenomena
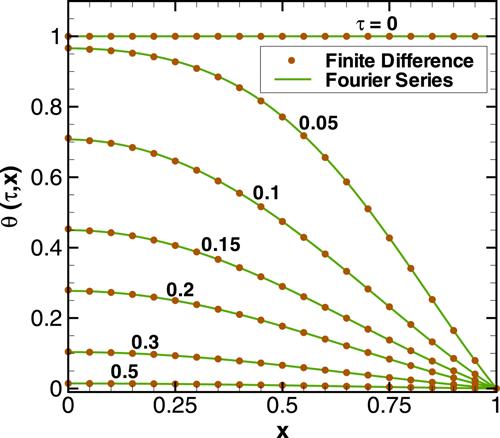
The use of contour flood plots and color digital movies is investigated for teaching fluid mechanics, heat transfer, and mass transfer at the first-year graduate student level. The color visualizations are intended to not only stimulate curiosity but also encourage enthusiasm and determination in learning difficult material. Although there is a significant amount of finite-difference material, the focus is on analytical solutions. In particular, the mathematical problems involve error functions and Fourier series, which generally prove uninteresting and unpopular. Students are encouraged to produce the visualizations themselves, in addition to being provided with digital results in various forms. Excel can be used to generate both the analytical and finite difference calculations, but Python or another computer language can be employed. While software, such as Matplotlib with Python, Gnuplot, or Tecplot, can create excellent contour flood plots, results from Excel are also good, and Powerpoint will produce movies from individual frames. Student response is positive, although quantifying their reaction is difficult based on the small class sizes. Not surprisingly, the use of color appeals to students and adds to their interest. In addition, students claim increased understanding with contour plots and movies, but the visualizations should be used in conjunction with more traditional graphs, perhaps augmented with consistent use of color. However, the impact on motivation due to color presentation is harder to establish. Interestingly, both graduate and senior undergraduate students showed about equal preference for the rainbow and viridis color palettes.
期刊介绍:
Computer Applications in Engineering Education provides a forum for publishing peer-reviewed timely information on the innovative uses of computers, Internet, and software tools in engineering education. Besides new courses and software tools, the CAE journal covers areas that support the integration of technology-based modules in the engineering curriculum and promotes discussion of the assessment and dissemination issues associated with these new implementation methods.
 求助内容:
求助内容: 应助结果提醒方式:


