Fadi Taher, Miriam Kliewer, Jean-Noel Albertini, Joris Vermunt, Raphael Doustaly, Corinna Walter, Markus Plimon, Jürgen Falkensammer, Herbert Langenberger, Afshin Assadian
{"title":"定制内移植物模拟技术的比较分析:物理原型与数值模拟","authors":"Fadi Taher, Miriam Kliewer, Jean-Noel Albertini, Joris Vermunt, Raphael Doustaly, Corinna Walter, Markus Plimon, Jürgen Falkensammer, Herbert Langenberger, Afshin Assadian","doi":"10.1007/s10353-023-00819-6","DOIUrl":null,"url":null,"abstract":"<h3 data-test=\"abstract-sub-heading\">Background</h3><p>The technical success of fenestrated endovascular aortic repair (FEVAR) relies on the exact fit of the custom-made endograft in the patient. Numerical simulation software has been made available (PLANOP™, PrediSurge) to digitally test the intended endograft design.</p><h3 data-test=\"abstract-sub-heading\">Methods</h3><p>The distance between opposite peaks of the proximal endograft sealing ring were measured on computed tomography (CT) scans of the test implantation within a 3D printed model, on numerical simulation software, and on postoperative CT (reference). Two types of modeling were used for the aorta in the numerical simulation software: rigid and deformable. This resulted in four measurements: (1) CT scan of the physical endograft prototype implanted in a rigid printed silicone model of the aorta, (2) rigid numerical or finite element (FE) simulation of the endograft implanted in a rigid aortic model, (3) numerical or FE simulation with a deformable virtual aortic model, and (4) patient postoperative CT.</p><h3 data-test=\"abstract-sub-heading\">Results</h3><p>Ten patients were included in the study. The mean distance between peaks was 26.8 mm in the postoperative CT scan (reference). The distance in the rigid printed model was 23.8 ± 2.0 mm <i>p</i> < 0.003). The FE analysis with rigid aorta measured 23.8 ± 1.5 mm (<i>p</i> < 0.006). Measurements performed on CT of the physical prototype test implanted in the printed silicone model of the aorta, and measurements from FE analysis with rigid modeling, were not significantly different. Measurements in a simulated deformable aorta were 27.4 ± 2.1 mm (<i>p </i> < 0.521). A high correlation (<i>r</i> = 0.81, <i>p</i> < 0.01) was found between measurements on postoperative CT and deformable aorta FE analysis.</p><h3 data-test=\"abstract-sub-heading\">Conclusion</h3><p>Numerical simulation with a rigid aorta may be a suitable substitute for traditional test implantation of a non-sterile prototype within a 3D aortic model. This may help reduce time for graft planning and fabrication. The FE analysis with a deformable aorta was able to predict peak-to-peak distances at the proximal sealing ring more reliably. The effect on clinical outcomes and endoleak occurrence remains to be elucidated in future trials.</p>","PeriodicalId":12253,"journal":{"name":"European Surgery","volume":"31 1","pages":""},"PeriodicalIF":0.0000,"publicationDate":"2023-12-11","publicationTypes":"Journal Article","fieldsOfStudy":null,"isOpenAccess":false,"openAccessPdf":"","citationCount":"0","resultStr":"{\"title\":\"Comparative analysis of custom-made endograft simulation techniques: physical prototypes versus numerical simulations\",\"authors\":\"Fadi Taher, Miriam Kliewer, Jean-Noel Albertini, Joris Vermunt, Raphael Doustaly, Corinna Walter, Markus Plimon, Jürgen Falkensammer, Herbert Langenberger, Afshin Assadian\",\"doi\":\"10.1007/s10353-023-00819-6\",\"DOIUrl\":null,\"url\":null,\"abstract\":\"<h3 data-test=\\\"abstract-sub-heading\\\">Background</h3><p>The technical success of fenestrated endovascular aortic repair (FEVAR) relies on the exact fit of the custom-made endograft in the patient. Numerical simulation software has been made available (PLANOP™, PrediSurge) to digitally test the intended endograft design.</p><h3 data-test=\\\"abstract-sub-heading\\\">Methods</h3><p>The distance between opposite peaks of the proximal endograft sealing ring were measured on computed tomography (CT) scans of the test implantation within a 3D printed model, on numerical simulation software, and on postoperative CT (reference). Two types of modeling were used for the aorta in the numerical simulation software: rigid and deformable. This resulted in four measurements: (1) CT scan of the physical endograft prototype implanted in a rigid printed silicone model of the aorta, (2) rigid numerical or finite element (FE) simulation of the endograft implanted in a rigid aortic model, (3) numerical or FE simulation with a deformable virtual aortic model, and (4) patient postoperative CT.</p><h3 data-test=\\\"abstract-sub-heading\\\">Results</h3><p>Ten patients were included in the study. The mean distance between peaks was 26.8 mm in the postoperative CT scan (reference). The distance in the rigid printed model was 23.8 ± 2.0 mm <i>p</i> < 0.003). The FE analysis with rigid aorta measured 23.8 ± 1.5 mm (<i>p</i> < 0.006). Measurements performed on CT of the physical prototype test implanted in the printed silicone model of the aorta, and measurements from FE analysis with rigid modeling, were not significantly different. Measurements in a simulated deformable aorta were 27.4 ± 2.1 mm (<i>p </i> < 0.521). A high correlation (<i>r</i> = 0.81, <i>p</i> < 0.01) was found between measurements on postoperative CT and deformable aorta FE analysis.</p><h3 data-test=\\\"abstract-sub-heading\\\">Conclusion</h3><p>Numerical simulation with a rigid aorta may be a suitable substitute for traditional test implantation of a non-sterile prototype within a 3D aortic model. This may help reduce time for graft planning and fabrication. The FE analysis with a deformable aorta was able to predict peak-to-peak distances at the proximal sealing ring more reliably. The effect on clinical outcomes and endoleak occurrence remains to be elucidated in future trials.</p>\",\"PeriodicalId\":12253,\"journal\":{\"name\":\"European Surgery\",\"volume\":\"31 1\",\"pages\":\"\"},\"PeriodicalIF\":0.0000,\"publicationDate\":\"2023-12-11\",\"publicationTypes\":\"Journal Article\",\"fieldsOfStudy\":null,\"isOpenAccess\":false,\"openAccessPdf\":\"\",\"citationCount\":\"0\",\"resultStr\":null,\"platform\":\"Semanticscholar\",\"paperid\":null,\"PeriodicalName\":\"European Surgery\",\"FirstCategoryId\":\"1085\",\"ListUrlMain\":\"https://doi.org/10.1007/s10353-023-00819-6\",\"RegionNum\":0,\"RegionCategory\":null,\"ArticlePicture\":[],\"TitleCN\":null,\"AbstractTextCN\":null,\"PMCID\":null,\"EPubDate\":\"\",\"PubModel\":\"\",\"JCR\":\"\",\"JCRName\":\"\",\"Score\":null,\"Total\":0}","platform":"Semanticscholar","paperid":null,"PeriodicalName":"European Surgery","FirstCategoryId":"1085","ListUrlMain":"https://doi.org/10.1007/s10353-023-00819-6","RegionNum":0,"RegionCategory":null,"ArticlePicture":[],"TitleCN":null,"AbstractTextCN":null,"PMCID":null,"EPubDate":"","PubModel":"","JCR":"","JCRName":"","Score":null,"Total":0}
引用次数: 0
摘要
背景开孔主动脉内膜修复术(FEVAR)的技术成功取决于定制内膜移植物与患者的精确吻合。数值模拟软件(PLANOP™, PrediSurge)可以对预期的内植物设计进行数字化测试。方法通过计算机断层扫描(CT)、数值模拟软件和术后 CT(参考)测量三维打印模型内测试植入的近端内植物密封环相对峰之间的距离。数值模拟软件对主动脉采用了两种建模方式:刚性和可变形。由此得出四种测量结果:(1) 对植入硬质印刷硅胶主动脉模型的物理内植物原型进行 CT 扫描;(2) 对植入硬质主动脉模型的内植物进行硬质数值或有限元 (FE) 模拟;(3) 使用可变形虚拟主动脉模型进行数值或 FE 模拟;(4) 患者术后 CT。术后 CT 扫描结果(参考值)显示,峰值之间的平均距离为 26.8 毫米。硬质打印模型的峰间距为 23.8 ± 2.0 mm p < 0.003)。硬质主动脉的 FE 分析测量值为 23.8 ± 1.5 毫米(p < 0.006)。在 CT 上对植入打印硅胶主动脉模型的物理原型测试进行的测量结果与采用刚性建模的 FE 分析得出的测量结果没有显著差异。模拟可变形主动脉的测量值为 27.4 ± 2.1 毫米(p < 0.521)。术后 CT 测量值与可变形主动脉 FE 分析值之间存在高度相关性(r = 0.81,p = 0.01)。这有助于缩短移植物规划和制造的时间。使用可变形主动脉进行的有限元分析能够更可靠地预测近端密封环的峰-峰距离。对临床效果和内漏发生率的影响还有待在未来的试验中加以阐明。
Comparative analysis of custom-made endograft simulation techniques: physical prototypes versus numerical simulations
Background
The technical success of fenestrated endovascular aortic repair (FEVAR) relies on the exact fit of the custom-made endograft in the patient. Numerical simulation software has been made available (PLANOP™, PrediSurge) to digitally test the intended endograft design.
Methods
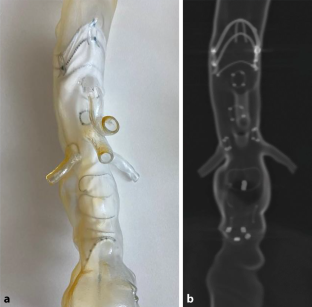
The distance between opposite peaks of the proximal endograft sealing ring were measured on computed tomography (CT) scans of the test implantation within a 3D printed model, on numerical simulation software, and on postoperative CT (reference). Two types of modeling were used for the aorta in the numerical simulation software: rigid and deformable. This resulted in four measurements: (1) CT scan of the physical endograft prototype implanted in a rigid printed silicone model of the aorta, (2) rigid numerical or finite element (FE) simulation of the endograft implanted in a rigid aortic model, (3) numerical or FE simulation with a deformable virtual aortic model, and (4) patient postoperative CT.
Results
Ten patients were included in the study. The mean distance between peaks was 26.8 mm in the postoperative CT scan (reference). The distance in the rigid printed model was 23.8 ± 2.0 mm p < 0.003). The FE analysis with rigid aorta measured 23.8 ± 1.5 mm (p < 0.006). Measurements performed on CT of the physical prototype test implanted in the printed silicone model of the aorta, and measurements from FE analysis with rigid modeling, were not significantly different. Measurements in a simulated deformable aorta were 27.4 ± 2.1 mm (p < 0.521). A high correlation (r = 0.81, p < 0.01) was found between measurements on postoperative CT and deformable aorta FE analysis.
Conclusion
Numerical simulation with a rigid aorta may be a suitable substitute for traditional test implantation of a non-sterile prototype within a 3D aortic model. This may help reduce time for graft planning and fabrication. The FE analysis with a deformable aorta was able to predict peak-to-peak distances at the proximal sealing ring more reliably. The effect on clinical outcomes and endoleak occurrence remains to be elucidated in future trials.

 求助内容:
求助内容: 应助结果提醒方式:


