{"title":"2006-2019 年美国急诊科疫情暴发前的频率和趋势。","authors":"George L Anesi, Ruiying Aria Xiong, M Kit Delgado","doi":"10.1097/CCE.0000000000000954","DOIUrl":null,"url":null,"abstract":"<p><strong>Objectives: </strong>To quantify the frequency, outside of the pandemic setting, with which individual healthcare facilities faced surge periods due to severe increases in demand for emergency department (ED) care.</p><p><strong>Design: </strong>Retrospective cohort study.</p><p><strong>Setting: </strong>U.S. EDs.</p><p><strong>Patients: </strong>All ED encounters in the all-payer, nationally representative Nationwide Emergency Department Sample from the Healthcare Cost and Utilization Project, 2006-2019.</p><p><strong>Interventions: </strong>None.</p><p><strong>Measurements and main results: </strong>Frequency of surge periods defined as ED months in which an individual facility ED saw a greater than 50% increase in ED visits per month above facility-/calendar month-specific medians. During 2006-2019, 3,317 U.S. EDs reported 354,534,229 ED visits across 142,035 ED months. Fifty-seven thousand four hundred ninety-five ED months (40.5%) during the study period had a 0% to 50% increase in ED visits that month above facility-specific medians and 1,952 ED months (1.4%) qualified as surge periods and had a greater than 50% increase in ED visits that month above facility-specific medians. These surge months were experienced by 397 unique facility EDs (12.0%). Compared with 2006, the most proximal pre-pandemic period of 2016-2019 had a notably elevated likelihood of ED-month surge periods (odds ratios [ORs], 2.36-2.84; all <i>p</i> < 0.0005). Compared with the calendar month of January, the winter ED months in December through March have similar likelihood of an ED-month qualifying as a surge period (ORs, 0.84-1.03; all <i>p</i> > 0.05), while the nonwinter ED months in April through November have a lower likelihood of an ED-month qualifying as a surge period (ORs, 0.65-0.81; all <i>p</i> < 0.05).</p><p><strong>Conclusions: </strong>Understanding the frequency of surges in demand for ED care-which appear to have increased in frequency even before the COVID-19 pandemic and are concentrated in winter months-is necessary to better understand the burden of potential and realized acute surge events and to inform cost-effectiveness preparedness strategies.</p>","PeriodicalId":10759,"journal":{"name":"Critical Care Explorations","volume":"5 8","pages":"e0954"},"PeriodicalIF":0.0000,"publicationDate":"2023-08-21","publicationTypes":"Journal Article","fieldsOfStudy":null,"isOpenAccess":false,"openAccessPdf":"https://ftp.ncbi.nlm.nih.gov/pub/pmc/oa_pdf/25/d4/cc9-5-e0954.PMC10443743.pdf","citationCount":"0","resultStr":"{\"title\":\"Frequency and Trends of Pre-Pandemic Surge Periods in U.S. Emergency Departments, 2006-2019.\",\"authors\":\"George L Anesi, Ruiying Aria Xiong, M Kit Delgado\",\"doi\":\"10.1097/CCE.0000000000000954\",\"DOIUrl\":null,\"url\":null,\"abstract\":\"<p><strong>Objectives: </strong>To quantify the frequency, outside of the pandemic setting, with which individual healthcare facilities faced surge periods due to severe increases in demand for emergency department (ED) care.</p><p><strong>Design: </strong>Retrospective cohort study.</p><p><strong>Setting: </strong>U.S. EDs.</p><p><strong>Patients: </strong>All ED encounters in the all-payer, nationally representative Nationwide Emergency Department Sample from the Healthcare Cost and Utilization Project, 2006-2019.</p><p><strong>Interventions: </strong>None.</p><p><strong>Measurements and main results: </strong>Frequency of surge periods defined as ED months in which an individual facility ED saw a greater than 50% increase in ED visits per month above facility-/calendar month-specific medians. During 2006-2019, 3,317 U.S. EDs reported 354,534,229 ED visits across 142,035 ED months. Fifty-seven thousand four hundred ninety-five ED months (40.5%) during the study period had a 0% to 50% increase in ED visits that month above facility-specific medians and 1,952 ED months (1.4%) qualified as surge periods and had a greater than 50% increase in ED visits that month above facility-specific medians. These surge months were experienced by 397 unique facility EDs (12.0%). Compared with 2006, the most proximal pre-pandemic period of 2016-2019 had a notably elevated likelihood of ED-month surge periods (odds ratios [ORs], 2.36-2.84; all <i>p</i> < 0.0005). Compared with the calendar month of January, the winter ED months in December through March have similar likelihood of an ED-month qualifying as a surge period (ORs, 0.84-1.03; all <i>p</i> > 0.05), while the nonwinter ED months in April through November have a lower likelihood of an ED-month qualifying as a surge period (ORs, 0.65-0.81; all <i>p</i> < 0.05).</p><p><strong>Conclusions: </strong>Understanding the frequency of surges in demand for ED care-which appear to have increased in frequency even before the COVID-19 pandemic and are concentrated in winter months-is necessary to better understand the burden of potential and realized acute surge events and to inform cost-effectiveness preparedness strategies.</p>\",\"PeriodicalId\":10759,\"journal\":{\"name\":\"Critical Care Explorations\",\"volume\":\"5 8\",\"pages\":\"e0954\"},\"PeriodicalIF\":0.0000,\"publicationDate\":\"2023-08-21\",\"publicationTypes\":\"Journal Article\",\"fieldsOfStudy\":null,\"isOpenAccess\":false,\"openAccessPdf\":\"https://ftp.ncbi.nlm.nih.gov/pub/pmc/oa_pdf/25/d4/cc9-5-e0954.PMC10443743.pdf\",\"citationCount\":\"0\",\"resultStr\":null,\"platform\":\"Semanticscholar\",\"paperid\":null,\"PeriodicalName\":\"Critical Care Explorations\",\"FirstCategoryId\":\"1085\",\"ListUrlMain\":\"https://doi.org/10.1097/CCE.0000000000000954\",\"RegionNum\":0,\"RegionCategory\":null,\"ArticlePicture\":[],\"TitleCN\":null,\"AbstractTextCN\":null,\"PMCID\":null,\"EPubDate\":\"2023/8/1 0:00:00\",\"PubModel\":\"eCollection\",\"JCR\":\"\",\"JCRName\":\"\",\"Score\":null,\"Total\":0}","platform":"Semanticscholar","paperid":null,"PeriodicalName":"Critical Care Explorations","FirstCategoryId":"1085","ListUrlMain":"https://doi.org/10.1097/CCE.0000000000000954","RegionNum":0,"RegionCategory":null,"ArticlePicture":[],"TitleCN":null,"AbstractTextCN":null,"PMCID":null,"EPubDate":"2023/8/1 0:00:00","PubModel":"eCollection","JCR":"","JCRName":"","Score":null,"Total":0}
引用次数: 0
摘要
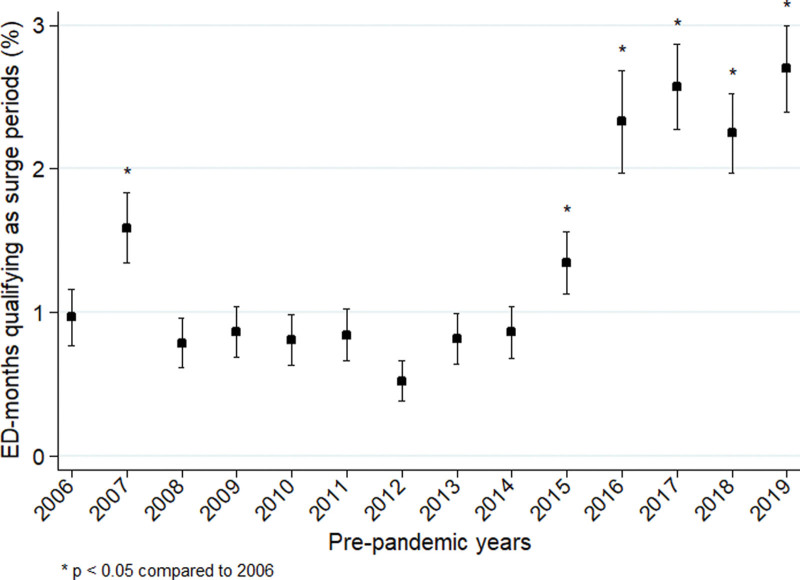
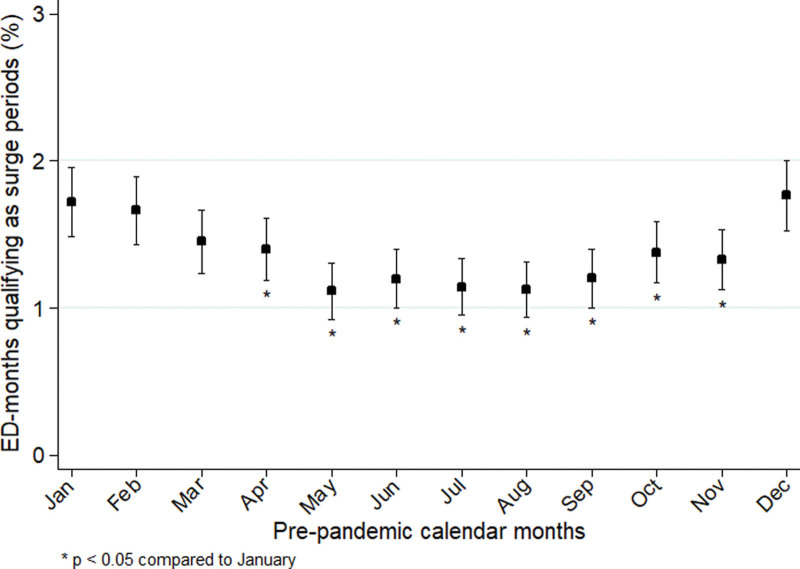
目标:量化在大流行病环境之外,个别医疗机构因急诊科(ED)护理需求剧增而面临激增的频率:量化各医疗机构在大流行之外,因急诊科(ED)护理需求剧增而面临激增期的频率:设计:回顾性队列研究:患者干预措施:无:测量和主要结果激增期的频率,定义为单个机构急诊科每月急诊就诊人次比机构/日历月特定中位数增加 50%以上的急诊月。2006-2019 年间,美国有 3,317 家急诊室在 142,035 个急诊室月中报告了 354,534,229 次急诊室就诊。在研究期间,有 57495 个 ED 月(40.5%)的当月急诊就诊人次增幅在 0% 至 50% 之间,超过了特定机构的中位数;有 1952 个 ED 月(1.4%)属于激增期,当月急诊就诊人次增幅超过 50%,超过了特定机构的中位数。有 397 家医疗机构的急诊室(12.0%)经历了这些急诊量激增的月份。与 2006 年相比,2016-2019 年最接近流行前的时期出现 ED 月激增期的可能性明显增加(几率比 [ORs],2.36-2.84;所有 p <0.0005)。与 1 月份相比,12 月至 3 月的冬季 ED 月出现 ED 月激增期的可能性相似(ORs,0.84-1.03;所有 p > 0.05),而 4 月至 11 月的非冬季 ED 月出现 ED 月激增期的可能性较低(ORs,0.65-0.81;所有 p < 0.05):了解急诊室护理需求激增的频率--甚至在 COVID-19 大流行之前,这种频率似乎就已经增加,并且集中在冬季--对于更好地了解潜在和已发生的急性激增事件的负担以及为成本效益准备策略提供信息是非常必要的。
Frequency and Trends of Pre-Pandemic Surge Periods in U.S. Emergency Departments, 2006-2019.
Objectives: To quantify the frequency, outside of the pandemic setting, with which individual healthcare facilities faced surge periods due to severe increases in demand for emergency department (ED) care.
Design: Retrospective cohort study.
Setting: U.S. EDs.
Patients: All ED encounters in the all-payer, nationally representative Nationwide Emergency Department Sample from the Healthcare Cost and Utilization Project, 2006-2019.
Interventions: None.
Measurements and main results: Frequency of surge periods defined as ED months in which an individual facility ED saw a greater than 50% increase in ED visits per month above facility-/calendar month-specific medians. During 2006-2019, 3,317 U.S. EDs reported 354,534,229 ED visits across 142,035 ED months. Fifty-seven thousand four hundred ninety-five ED months (40.5%) during the study period had a 0% to 50% increase in ED visits that month above facility-specific medians and 1,952 ED months (1.4%) qualified as surge periods and had a greater than 50% increase in ED visits that month above facility-specific medians. These surge months were experienced by 397 unique facility EDs (12.0%). Compared with 2006, the most proximal pre-pandemic period of 2016-2019 had a notably elevated likelihood of ED-month surge periods (odds ratios [ORs], 2.36-2.84; all p < 0.0005). Compared with the calendar month of January, the winter ED months in December through March have similar likelihood of an ED-month qualifying as a surge period (ORs, 0.84-1.03; all p > 0.05), while the nonwinter ED months in April through November have a lower likelihood of an ED-month qualifying as a surge period (ORs, 0.65-0.81; all p < 0.05).
Conclusions: Understanding the frequency of surges in demand for ED care-which appear to have increased in frequency even before the COVID-19 pandemic and are concentrated in winter months-is necessary to better understand the burden of potential and realized acute surge events and to inform cost-effectiveness preparedness strategies.

 求助内容:
求助内容: 应助结果提醒方式:


