Refractive outcome and lens power calculation after intrascleral intraocular lens fixation: a comparison of three-piece and one-piece intrascleral fixation technique.
Markus Schranz, Adrian Reumüller, Klaudia Kostolna, Caroline Novotny, Daniel Schartmüller, Claudette Abela-Formanek
{"title":"Refractive outcome and lens power calculation after intrascleral intraocular lens fixation: a comparison of three-piece and one-piece intrascleral fixation technique.","authors":"Markus Schranz, Adrian Reumüller, Klaudia Kostolna, Caroline Novotny, Daniel Schartmüller, Claudette Abela-Formanek","doi":"10.1186/s40662-023-00341-6","DOIUrl":null,"url":null,"abstract":"<p><strong>Purpose: </strong>To evaluate the refractive prediction error of common intraocular lens (IOL) power calculation formulae in patients who underwent intrascleral IOL fixation using two different techniques.</p><p><strong>Methods: </strong>This is a prospective, randomized, longitudinal, single-site, single-surgeon study. Patients who underwent intrascleral IOL implantation using the Yamane or the Carlevale technique were followed up for a period of six months postoperatively. Refraction was measured using the best-corrected visual acuity at 4 m (EDTRS chart). Lens decentration, tilt and effective lens position (ELP) were assessed using an anterior segment optical coherence tomography (AS-OCT). The prediction error (PE) and the absolute error (AE) were evaluated for the SRK/T, Hollayday1 and Hoffer Q formula. Subsequently, correlations between the PE and axial length, keratometry, white to white and ELP were assessed.</p><p><strong>Results: </strong>In total, 53 eyes of 53 patients were included in the study. Twenty-four eyes of 24 patients were in the Yamane group (YG) and 29 eyes of 29 patients were in the Carlevale group (CG). In the YG, the Holladay 1 and Hoffer Q formulae resulted in a hyperopic PE (0.02 ± 0.56 D, and 0.13 ± 0.64 D, respectively) while in the SRK/T formula the PE was slightly myopic (- 0.16 ± 0.56 D). In the CG, SRK/T and Holladay 1 formulae led to a myopic PE (- 0.1 ± 0.80 D and - 0.04 ± 0.74 D, respectively), Hoffer Q to a hyperopic PE (0.04 ± 0.75 D). There was no difference between the PE of the same formulae across both groups (P > 0.05). In both groups the AE differed significantly from zero in each evaluated formula. The AE error was within ± 0.50 D in 45%-71% and was within ± 1.00 D in 72%-92% of eyes depending on the formula and surgical method used. No significant differences were found between formulae within and across groups (P > 0.05). Intraocular lens tilt was lower in the CG (6.45 ± 2.03°) compared to the YG (7.67 ± 3.70°) (P < 0.001). Lens decentration was higher in the YG (0.57 ± 0.37 mm) than in the CG (0.38 ± 0.21 mm), though the difference was not statistically significant (P = 0.9996).</p><p><strong>Conclusions: </strong>Refractive predictability was similar in both groups. IOL tilt was better in the CG, however this did not influence the refractive predictability. Though not significant, Holladay 1 formula seemed to be more probable than the SRK/T and Hoffer Q formulae. However, significant outliers were observed in all three different formulae and therefore remain a challenging task in secondary fixated IOLs.</p>","PeriodicalId":73010,"journal":{"name":"","volume":"10 1","pages":"29"},"PeriodicalIF":0.0,"publicationDate":"2023-06-09","publicationTypes":"Journal Article","fieldsOfStudy":null,"isOpenAccess":false,"openAccessPdf":"https://www.ncbi.nlm.nih.gov/pmc/articles/PMC10251628/pdf/","citationCount":"0","resultStr":null,"platform":"Semanticscholar","paperid":null,"PeriodicalName":"","FirstCategoryId":"3","ListUrlMain":"https://doi.org/10.1186/s40662-023-00341-6","RegionNum":0,"RegionCategory":null,"ArticlePicture":[],"TitleCN":null,"AbstractTextCN":null,"PMCID":null,"EPubDate":"","PubModel":"","JCR":"","JCRName":"","Score":null,"Total":0}
引用次数: 0
Abstract
Purpose: To evaluate the refractive prediction error of common intraocular lens (IOL) power calculation formulae in patients who underwent intrascleral IOL fixation using two different techniques.
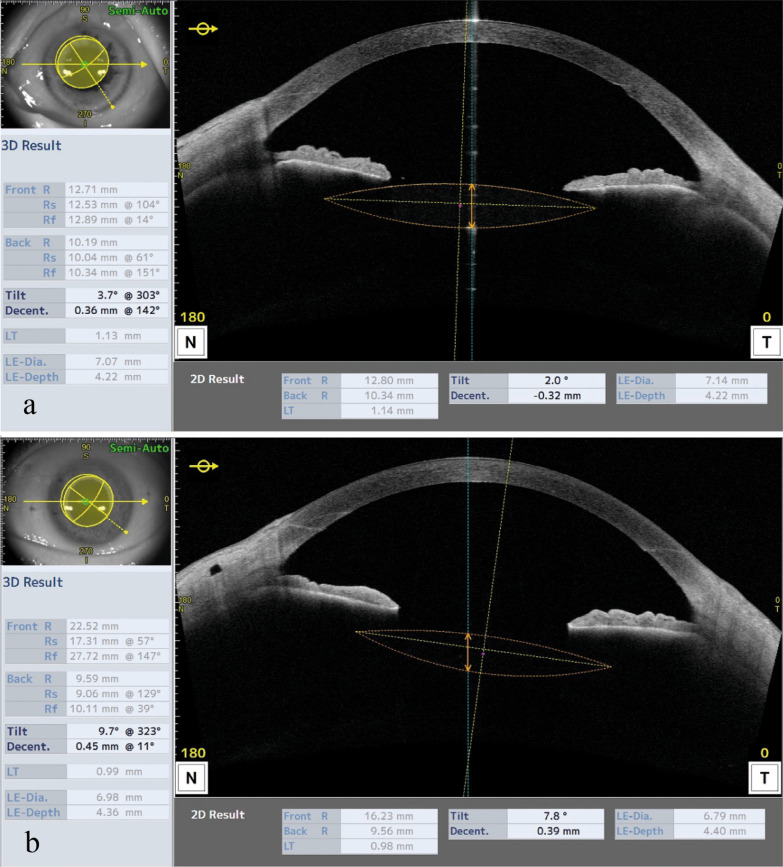
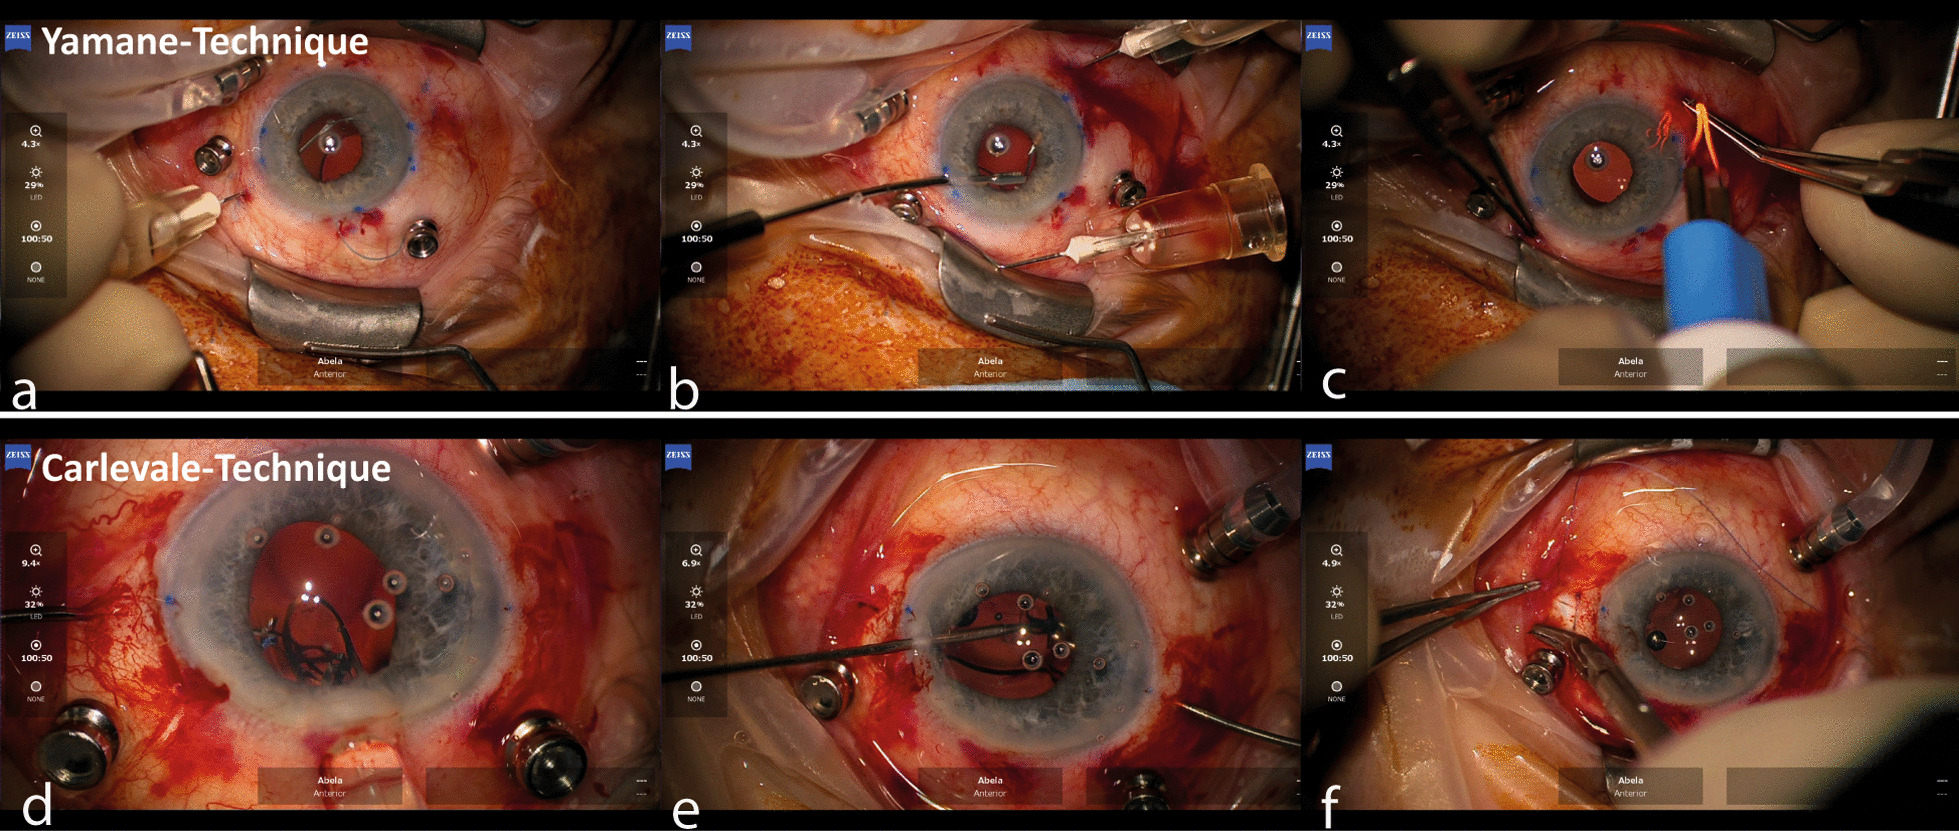
Methods: This is a prospective, randomized, longitudinal, single-site, single-surgeon study. Patients who underwent intrascleral IOL implantation using the Yamane or the Carlevale technique were followed up for a period of six months postoperatively. Refraction was measured using the best-corrected visual acuity at 4 m (EDTRS chart). Lens decentration, tilt and effective lens position (ELP) were assessed using an anterior segment optical coherence tomography (AS-OCT). The prediction error (PE) and the absolute error (AE) were evaluated for the SRK/T, Hollayday1 and Hoffer Q formula. Subsequently, correlations between the PE and axial length, keratometry, white to white and ELP were assessed.
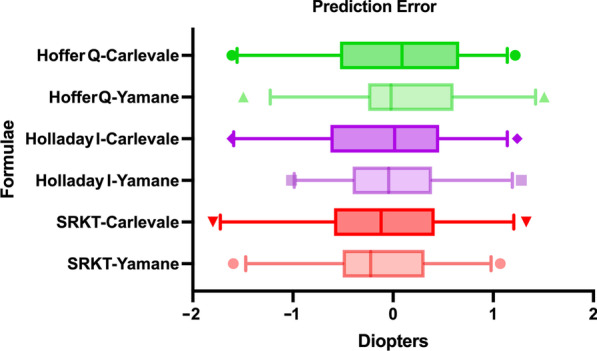
Results: In total, 53 eyes of 53 patients were included in the study. Twenty-four eyes of 24 patients were in the Yamane group (YG) and 29 eyes of 29 patients were in the Carlevale group (CG). In the YG, the Holladay 1 and Hoffer Q formulae resulted in a hyperopic PE (0.02 ± 0.56 D, and 0.13 ± 0.64 D, respectively) while in the SRK/T formula the PE was slightly myopic (- 0.16 ± 0.56 D). In the CG, SRK/T and Holladay 1 formulae led to a myopic PE (- 0.1 ± 0.80 D and - 0.04 ± 0.74 D, respectively), Hoffer Q to a hyperopic PE (0.04 ± 0.75 D). There was no difference between the PE of the same formulae across both groups (P > 0.05). In both groups the AE differed significantly from zero in each evaluated formula. The AE error was within ± 0.50 D in 45%-71% and was within ± 1.00 D in 72%-92% of eyes depending on the formula and surgical method used. No significant differences were found between formulae within and across groups (P > 0.05). Intraocular lens tilt was lower in the CG (6.45 ± 2.03°) compared to the YG (7.67 ± 3.70°) (P < 0.001). Lens decentration was higher in the YG (0.57 ± 0.37 mm) than in the CG (0.38 ± 0.21 mm), though the difference was not statistically significant (P = 0.9996).
Conclusions: Refractive predictability was similar in both groups. IOL tilt was better in the CG, however this did not influence the refractive predictability. Though not significant, Holladay 1 formula seemed to be more probable than the SRK/T and Hoffer Q formulae. However, significant outliers were observed in all three different formulae and therefore remain a challenging task in secondary fixated IOLs.
 求助内容:
求助内容: 应助结果提醒方式:


