Alexandra K Kunzelmann, Karin Binder, Martin R Fischer, Martin Reincke, Leah T Braun, Ralf Schmidmaier
{"title":"Improving Diagnostic Efficiency with Frequency Double-Trees and Frequency Nets in Bayesian Reasoning.","authors":"Alexandra K Kunzelmann, Karin Binder, Martin R Fischer, Martin Reincke, Leah T Braun, Ralf Schmidmaier","doi":"10.1177/23814683221086623","DOIUrl":null,"url":null,"abstract":"<p><p><b>Background.</b> Medical students often have problems with Bayesian reasoning situations. Representing statistical information as natural frequencies (instead of probabilities) and visualizing them (e.g., with double-trees or net diagrams) leads to higher accuracy in solving these tasks. However, double-trees and net diagrams (which already contain the correct solution of the task, so that the solution could be read of the diagrams) have not yet been studied in medical education. This study examined the influence of information format (probabilities v. frequencies) and visualization (double-tree v. net diagram) on the accuracy and speed of Bayesian judgments. <b>Methods.</b> A total of 142 medical students at different university medical schools (Munich, Kiel, Goettingen, Erlangen, Nuremberg, Berlin, Regensburg) in Germany predicted posterior probabilities in 4 different medical Bayesian reasoning tasks, resulting in a 3-factorial 2 × 2 × 4 design. The diagnostic efficiency for the different versions was represented as the median time divided by the percentage of correct inferences. <b>Results.</b> Frequency visualizations led to a significantly higher accuracy and faster judgments than did probability visualizations. Participants solved 80% of the tasks correctly in the frequency double-tree and the frequency net diagram. Visualizations with probabilities also led to relatively high performance rates: 73% in the probability double-tree and 70% in the probability net diagram. The median time for a correct inference was fastest with the frequency double tree (2:08 min) followed by the frequency net diagram and the probability double-tree (both 2:26 min) and probability net diagram (2:33 min). The type of visualization did not result in a significant difference. <b>Discussion.</b> Frequency double-trees and frequency net diagrams help answer Bayesian tasks more accurately and also more quickly than the respective probability visualizations. Surprisingly, the effect of information format (probabilities v. frequencies) on performance was higher in previous studies: medical students seem also quite capable of identifying the correct solution to the Bayesian task, among other probabilities in the probability visualizations.</p><p><strong>Highlights: </strong>Frequency double-trees and frequency nets help answer Bayesian tasks not only more accurately but also more quickly than the respective probability visualizations.In double-trees and net diagrams, the effect of the information format (probabilities v. natural frequencies) on performance is remarkably lower in this high-performing sample than that shown in previous studies.</p>","PeriodicalId":520707,"journal":{"name":"MDM policy & practice","volume":" ","pages":"23814683221086623"},"PeriodicalIF":1.7000,"publicationDate":"2022-03-16","publicationTypes":"Journal Article","fieldsOfStudy":null,"isOpenAccess":false,"openAccessPdf":"https://ftp.ncbi.nlm.nih.gov/pub/pmc/oa_pdf/6e/41/10.1177_23814683221086623.PMC8935422.pdf","citationCount":"3","resultStr":null,"platform":"Semanticscholar","paperid":null,"PeriodicalName":"MDM policy & practice","FirstCategoryId":"1085","ListUrlMain":"https://doi.org/10.1177/23814683221086623","RegionNum":0,"RegionCategory":null,"ArticlePicture":[],"TitleCN":null,"AbstractTextCN":null,"PMCID":null,"EPubDate":"2022/1/1 0:00:00","PubModel":"eCollection","JCR":"","JCRName":"","Score":null,"Total":0}
引用次数: 3
Abstract
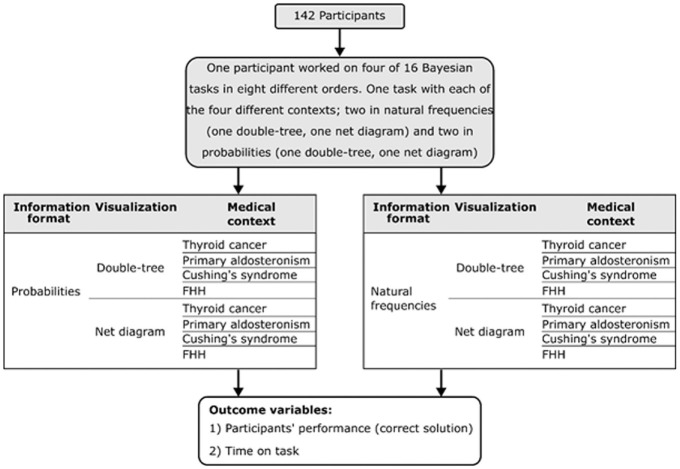
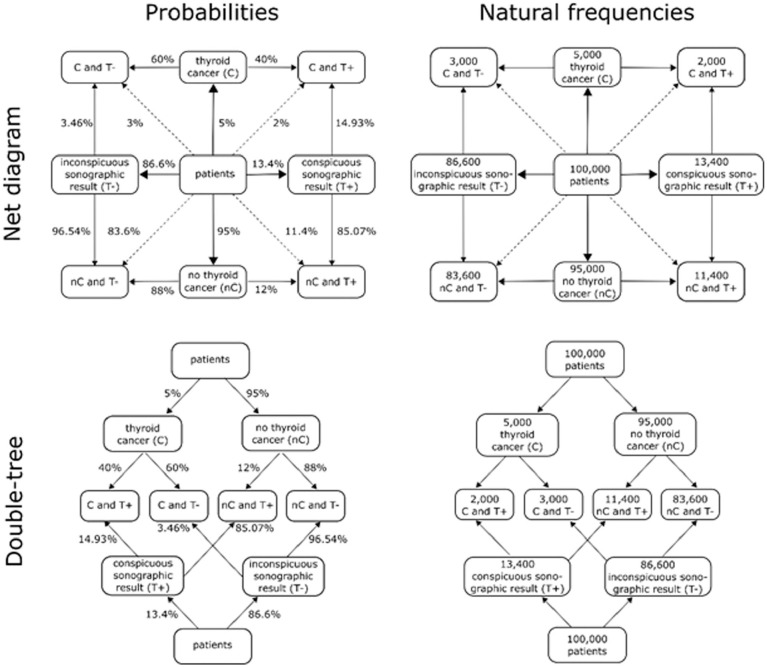
Background. Medical students often have problems with Bayesian reasoning situations. Representing statistical information as natural frequencies (instead of probabilities) and visualizing them (e.g., with double-trees or net diagrams) leads to higher accuracy in solving these tasks. However, double-trees and net diagrams (which already contain the correct solution of the task, so that the solution could be read of the diagrams) have not yet been studied in medical education. This study examined the influence of information format (probabilities v. frequencies) and visualization (double-tree v. net diagram) on the accuracy and speed of Bayesian judgments. Methods. A total of 142 medical students at different university medical schools (Munich, Kiel, Goettingen, Erlangen, Nuremberg, Berlin, Regensburg) in Germany predicted posterior probabilities in 4 different medical Bayesian reasoning tasks, resulting in a 3-factorial 2 × 2 × 4 design. The diagnostic efficiency for the different versions was represented as the median time divided by the percentage of correct inferences. Results. Frequency visualizations led to a significantly higher accuracy and faster judgments than did probability visualizations. Participants solved 80% of the tasks correctly in the frequency double-tree and the frequency net diagram. Visualizations with probabilities also led to relatively high performance rates: 73% in the probability double-tree and 70% in the probability net diagram. The median time for a correct inference was fastest with the frequency double tree (2:08 min) followed by the frequency net diagram and the probability double-tree (both 2:26 min) and probability net diagram (2:33 min). The type of visualization did not result in a significant difference. Discussion. Frequency double-trees and frequency net diagrams help answer Bayesian tasks more accurately and also more quickly than the respective probability visualizations. Surprisingly, the effect of information format (probabilities v. frequencies) on performance was higher in previous studies: medical students seem also quite capable of identifying the correct solution to the Bayesian task, among other probabilities in the probability visualizations.
Highlights: Frequency double-trees and frequency nets help answer Bayesian tasks not only more accurately but also more quickly than the respective probability visualizations.In double-trees and net diagrams, the effect of the information format (probabilities v. natural frequencies) on performance is remarkably lower in this high-performing sample than that shown in previous studies.

 求助内容:
求助内容: 应助结果提醒方式:


