{"title":"An algorithm to generate correlated input-parameters to be used in probabilistic sensitivity analyses.","authors":"Mohamed Neine, Desmond Curran","doi":"10.1080/20016689.2020.1857052","DOIUrl":null,"url":null,"abstract":"<p><p><b>Background</b>: Assessment of uncertainty in cost-effectiveness analyses (CEAs) is paramount for decision-making. Probabilistic sensitivity analysis (PSA) estimates uncertainty by varying all input parameters simultaneously within predefined ranges; however, PSA often ignores correlations between parameters. <b>Objective</b>: To implement an efficient algorithm that integrates parameter correlation in PSA. <b>Study design</b>: An algorithm based on Cholesky decomposition was developed to generate multivariate non-normal parameter distributions for the age-dependent incidence of herpes zoster (HZ). The algorithm was implemented in an HZ CEA model and evaluated for gamma and beta distributions. The incremental cost-effectiveness ratio (ICER) and the probability of being cost-effective at a given ICER threshold were calculated for different levels of correlation. Five thousand Monte Carlo simulations were carried out. <b>Results</b>: Correlation coefficients between parameters sampled from the distribution generated by the algorithm matched the desired correlations for both distribution functions. With correlations set to 0.0, 0.5, and 0.9, 90% of the simulations showed ICERs below $25,000, $33,000, and $38,000 per quality-adjusted life-year (QALY), respectively, varying incidence only; and below $38,000, $48,000, and $58,000 per QALY, respectively, varying most parameters. <b>Conclusion</b>: Parameter correlation may impact the uncertainty of CEA results. We implemented an efficient method for generating correlated non-normal distributions for use in PSA.</p>","PeriodicalId":73811,"journal":{"name":"Journal of market access & health policy","volume":"9 1","pages":"1857052"},"PeriodicalIF":0.0000,"publicationDate":"2020-12-15","publicationTypes":"Journal Article","fieldsOfStudy":null,"isOpenAccess":false,"openAccessPdf":"https://sci-hub-pdf.com/10.1080/20016689.2020.1857052","citationCount":"2","resultStr":null,"platform":"Semanticscholar","paperid":null,"PeriodicalName":"Journal of market access & health policy","FirstCategoryId":"1085","ListUrlMain":"https://doi.org/10.1080/20016689.2020.1857052","RegionNum":0,"RegionCategory":null,"ArticlePicture":[],"TitleCN":null,"AbstractTextCN":null,"PMCID":null,"EPubDate":"","PubModel":"","JCR":"Q2","JCRName":"Medicine","Score":null,"Total":0}
引用次数: 2
Abstract
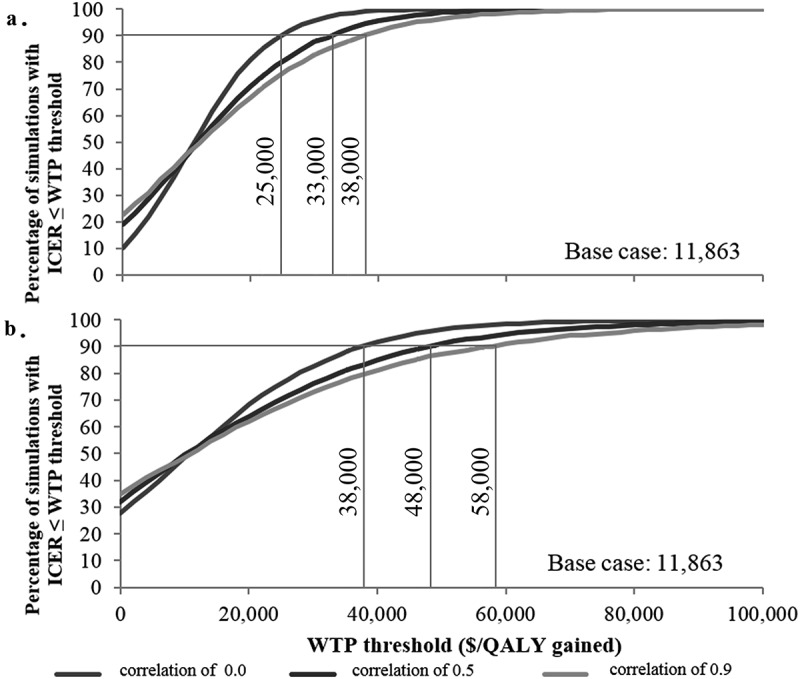
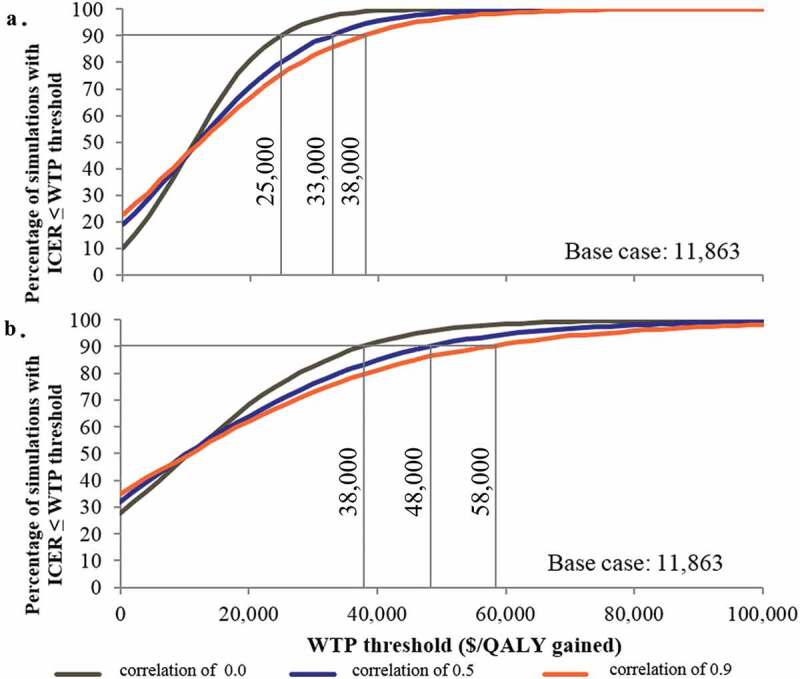
Background: Assessment of uncertainty in cost-effectiveness analyses (CEAs) is paramount for decision-making. Probabilistic sensitivity analysis (PSA) estimates uncertainty by varying all input parameters simultaneously within predefined ranges; however, PSA often ignores correlations between parameters. Objective: To implement an efficient algorithm that integrates parameter correlation in PSA. Study design: An algorithm based on Cholesky decomposition was developed to generate multivariate non-normal parameter distributions for the age-dependent incidence of herpes zoster (HZ). The algorithm was implemented in an HZ CEA model and evaluated for gamma and beta distributions. The incremental cost-effectiveness ratio (ICER) and the probability of being cost-effective at a given ICER threshold were calculated for different levels of correlation. Five thousand Monte Carlo simulations were carried out. Results: Correlation coefficients between parameters sampled from the distribution generated by the algorithm matched the desired correlations for both distribution functions. With correlations set to 0.0, 0.5, and 0.9, 90% of the simulations showed ICERs below $25,000, $33,000, and $38,000 per quality-adjusted life-year (QALY), respectively, varying incidence only; and below $38,000, $48,000, and $58,000 per QALY, respectively, varying most parameters. Conclusion: Parameter correlation may impact the uncertainty of CEA results. We implemented an efficient method for generating correlated non-normal distributions for use in PSA.

 求助内容:
求助内容: 应助结果提醒方式:


