{"title":"Computing and graphing probability values of pearson distributions: a SAS/IML macro.","authors":"Qing Yang, Xinming An, Wei Pan","doi":"10.1186/s13029-019-0076-2","DOIUrl":null,"url":null,"abstract":"<p><strong>Background: </strong>Any empirical data can be approximated to one of Pearson distributions using the first four moments of the data (Elderton WP, Johnson NL. Systems of Frequency Curves. 1969; Pearson K. Philos Trans R Soc Lond Ser A. 186:343-414 1895; Solomon H, Stephens MA. J Am Stat Assoc. 73(361):153-60 1978). Thus, Pearson distributions made statistical analysis possible for data with unknown distributions. There are both extant, old-fashioned in-print tables (Pearson ES, Hartley HO. Biometrika Tables for Statisticians, vol. II. 1972) and contemporary computer programs (Amos DE, Daniel SL. Tables of percentage points of standardized pearson distributions. 1971; Bouver H, Bargmann RE. Tables of the standardized percentage points of the pearson system of curves in terms of <i>β</i> <sub>1</sub> and <i>β</i> <sub>2</sub>. 1974; Bowman KO, Shenton LR. Biometrika. 66(1):147-51 1979; Davis CS, Stephens MA. Appl Stat. 32(3):322-7 1983; Pan W. J Stat Softw. 31(Code Snippet 2):1-6 2009) available for obtaining percentage points of Pearson distributions corresponding to certain <i>pre-specified</i> percentages (or probability values; e.g., 1.0%, 2.5%, 5.0%, etc.), but they are little useful in statistical analysis because we have to rely on unwieldy second difference interpolation to calculate a probability value of a Pearson distribution corresponding to a given percentage point, such as an observed test statistic in hypothesis testing.</p><p><strong>Results: </strong>The present study develops a SAS/IML macro program to identify the appropriate type of Pearson distribution based on either input of dataset or the values of four moments and then compute and graph probability values of Pearson distributions for <i>any</i> given percentage points.</p><p><strong>Conclusions: </strong>The SAS macro program returns accurate approximations to Pearson distributions and can efficiently facilitate researchers to conduct statistical analysis on data with unknown distributions.</p>","PeriodicalId":35052,"journal":{"name":"Source Code for Biology and Medicine","volume":"14 ","pages":"6"},"PeriodicalIF":0.0000,"publicationDate":"2019-12-20","publicationTypes":"Journal Article","fieldsOfStudy":null,"isOpenAccess":false,"openAccessPdf":"https://sci-hub-pdf.com/10.1186/s13029-019-0076-2","citationCount":"3","resultStr":null,"platform":"Semanticscholar","paperid":null,"PeriodicalName":"Source Code for Biology and Medicine","FirstCategoryId":"1085","ListUrlMain":"https://doi.org/10.1186/s13029-019-0076-2","RegionNum":0,"RegionCategory":null,"ArticlePicture":[],"TitleCN":null,"AbstractTextCN":null,"PMCID":null,"EPubDate":"2019/1/1 0:00:00","PubModel":"eCollection","JCR":"Q2","JCRName":"Decision Sciences","Score":null,"Total":0}
引用次数: 3
Abstract
Background: Any empirical data can be approximated to one of Pearson distributions using the first four moments of the data (Elderton WP, Johnson NL. Systems of Frequency Curves. 1969; Pearson K. Philos Trans R Soc Lond Ser A. 186:343-414 1895; Solomon H, Stephens MA. J Am Stat Assoc. 73(361):153-60 1978). Thus, Pearson distributions made statistical analysis possible for data with unknown distributions. There are both extant, old-fashioned in-print tables (Pearson ES, Hartley HO. Biometrika Tables for Statisticians, vol. II. 1972) and contemporary computer programs (Amos DE, Daniel SL. Tables of percentage points of standardized pearson distributions. 1971; Bouver H, Bargmann RE. Tables of the standardized percentage points of the pearson system of curves in terms of β1 and β2. 1974; Bowman KO, Shenton LR. Biometrika. 66(1):147-51 1979; Davis CS, Stephens MA. Appl Stat. 32(3):322-7 1983; Pan W. J Stat Softw. 31(Code Snippet 2):1-6 2009) available for obtaining percentage points of Pearson distributions corresponding to certain pre-specified percentages (or probability values; e.g., 1.0%, 2.5%, 5.0%, etc.), but they are little useful in statistical analysis because we have to rely on unwieldy second difference interpolation to calculate a probability value of a Pearson distribution corresponding to a given percentage point, such as an observed test statistic in hypothesis testing.
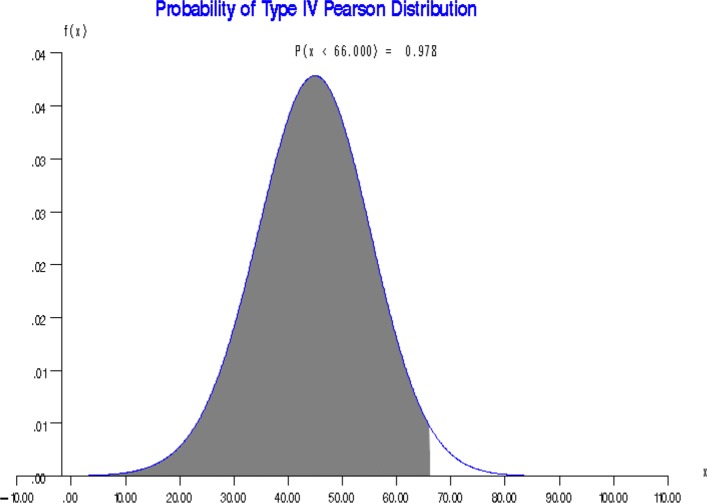
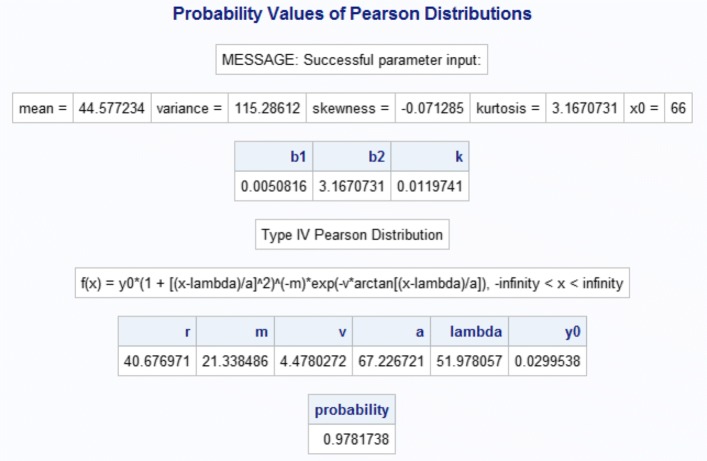
Results: The present study develops a SAS/IML macro program to identify the appropriate type of Pearson distribution based on either input of dataset or the values of four moments and then compute and graph probability values of Pearson distributions for any given percentage points.
Conclusions: The SAS macro program returns accurate approximations to Pearson distributions and can efficiently facilitate researchers to conduct statistical analysis on data with unknown distributions.
背景:任何经验数据都可以使用数据的前四个矩近似于皮尔逊分布之一(Elderton WP, Johnson NL)。频率曲线系统。1969;皮尔逊K. Philos Trans R Soc Ser . 186:343-414 1895;所罗门H,斯蒂芬斯MA。科学通报,23(3):393 - 398。因此,皮尔逊分布使得对未知分布的数据进行统计分析成为可能。现存的老式印刷表格都有(Pearson ES, Hartley HO)。统计学家生物计量表,第二卷。1972)和当代计算机程序(Amos DE, Daniel SL.标准化皮尔逊分布的百分比表)。1971;Bouver H, Bargmann RE.用β 1和β 2表示的皮尔逊曲线系统的标准化百分比表。1974;鲍曼KO,申顿LR。中华生物医学杂志,66(1):147-51 1979;Davis CS, Stephens MA。苹果统计,32(3):322-7 1983;Pan W. J Stat software . 31(代码片段2):1-6 2009)可用于获得与某些预先指定的百分比(或概率值;例如,1.0%,2.5%,5.0%等),但它们在统计分析中用处不大,因为我们必须依靠笨拙的二次差分插值来计算皮尔逊分布对应于给定百分点的概率值,例如假设检验中的观察检验统计量。结果:本研究开发了一个SAS/IML宏程序,根据数据集的输入或四个矩的值来识别适当类型的皮尔逊分布,然后计算并绘制任何给定百分比的皮尔逊分布的概率值。结论:SAS宏程序返回的Pearson分布的精确近似值,可以有效地方便研究者对未知分布的数据进行统计分析。
期刊介绍:
Source Code for Biology and Medicine is a peer-reviewed open access, online journal that publishes articles on source code employed over a wide range of applications in biology and medicine. The journal"s aim is to publish source code for distribution and use in the public domain in order to advance biological and medical research. Through this dissemination, it may be possible to shorten the time required for solving certain computational problems for which there is limited source code availability or resources.

 求助内容:
求助内容: 应助结果提醒方式:


