The Spatial Distribution of Adult Obesity Prevalence in Denver County, Colorado: An Empirical Bayes Approach to Adjust EHR-Derived Small Area Estimates.
David C Tabano, Kirk Bol, Sophia R Newcomer, Jennifer C Barrow, Matthew F Daley
{"title":"The Spatial Distribution of Adult Obesity Prevalence in Denver County, Colorado: An Empirical Bayes Approach to Adjust EHR-Derived Small Area Estimates.","authors":"David C Tabano, Kirk Bol, Sophia R Newcomer, Jennifer C Barrow, Matthew F Daley","doi":"10.5334/egems.245","DOIUrl":null,"url":null,"abstract":"<p><strong>Objectives: </strong>Measuring obesity prevalence across geographic areas should account for environmental and socioeconomic factors that contribute to spatial autocorrelation, the dependency of values in estimates across neighboring areas, to mitigate the bias in measures and risk of type I errors in hypothesis testing. Dependency among observations across geographic areas violates statistical independence assumptions and may result in biased estimates. Empirical Bayes (EB) estimators reduce the variability of estimates with spatial autocorrelation, which limits the overall mean square-error and controls for sample bias.</p><p><strong>Methods: </strong>Using the Colorado Body Mass Index (BMI) Monitoring System, we modeled the spatial autocorrelation of adult (≥ 18 years old) obesity (BMI ≥ 30 kg m<sup>2</sup>) measurements using patient-level electronic health record data from encounters between January 1, 2009, and December 31, 2011. Obesity prevalence was estimated among census tracts with >=10 observations in Denver County census tracts during the study period. We calculated the Moran's I statistic to test for spatial autocorrelation across census tracts, and mapped crude and EB obesity prevalence across geographic areas.</p><p><strong>Results: </strong>In Denver County, there were 143 census tracts with 10 or more observations, representing a total of 97,710 adults with a valid BMI. The crude obesity prevalence for adults in Denver County was 29.8 percent (95% CI 28.4-31.1%) and ranged from 12.8 to 45.2 percent across individual census tracts. EB obesity prevalence was 30.2 percent (95% CI 28.9-31.5%) and ranged from 15.3 to 44.3 percent across census tracts. Statistical tests using the Moran's I statistic suggest adult obesity prevalence in Denver County was distributed in a non-random pattern. Clusters of EB obesity estimates were highly significant (alpha=0.05) in neighboring census tracts. Concentrations of obesity estimates were primarily in the west and north in Denver County.</p><p><strong>Conclusions: </strong>Statistical tests reveal adult obesity prevalence exhibit spatial autocorrelation in Denver County at the census tract level. EB estimates for obesity prevalence can be used to control for spatial autocorrelation between neighboring census tracts and may produce less biased estimates of obesity prevalence.</p>","PeriodicalId":72880,"journal":{"name":"EGEMS (Washington, DC)","volume":"5 1","pages":"24"},"PeriodicalIF":0.0000,"publicationDate":"2017-12-06","publicationTypes":"Journal Article","fieldsOfStudy":null,"isOpenAccess":false,"openAccessPdf":"https://ftp.ncbi.nlm.nih.gov/pub/pmc/oa_pdf/2e/54/egems-5-1-245.PMC5982995.pdf","citationCount":"1","resultStr":null,"platform":"Semanticscholar","paperid":null,"PeriodicalName":"EGEMS (Washington, DC)","FirstCategoryId":"1085","ListUrlMain":"https://doi.org/10.5334/egems.245","RegionNum":0,"RegionCategory":null,"ArticlePicture":[],"TitleCN":null,"AbstractTextCN":null,"PMCID":null,"EPubDate":"","PubModel":"","JCR":"","JCRName":"","Score":null,"Total":0}
引用次数: 1
Abstract
Objectives: Measuring obesity prevalence across geographic areas should account for environmental and socioeconomic factors that contribute to spatial autocorrelation, the dependency of values in estimates across neighboring areas, to mitigate the bias in measures and risk of type I errors in hypothesis testing. Dependency among observations across geographic areas violates statistical independence assumptions and may result in biased estimates. Empirical Bayes (EB) estimators reduce the variability of estimates with spatial autocorrelation, which limits the overall mean square-error and controls for sample bias.
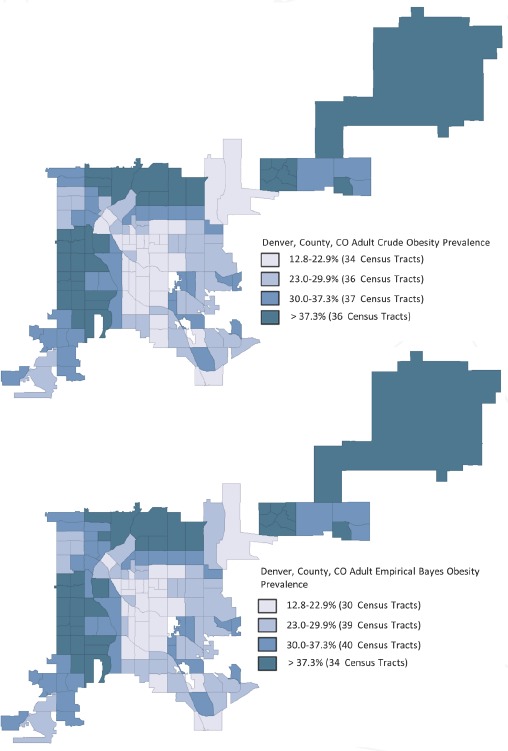
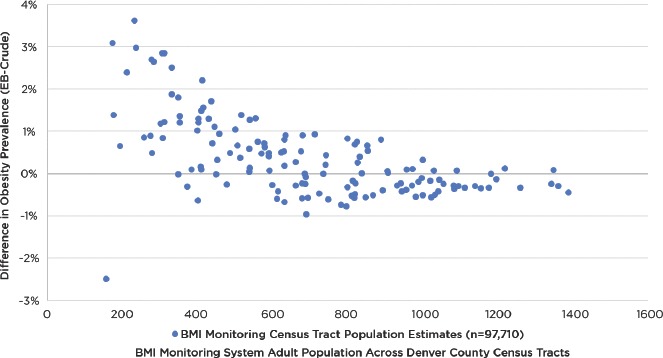
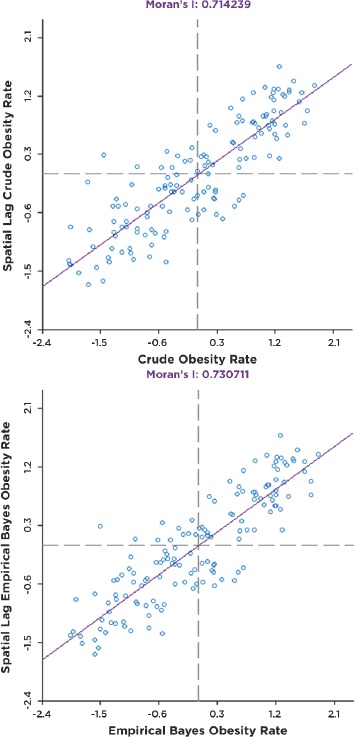
Methods: Using the Colorado Body Mass Index (BMI) Monitoring System, we modeled the spatial autocorrelation of adult (≥ 18 years old) obesity (BMI ≥ 30 kg m2) measurements using patient-level electronic health record data from encounters between January 1, 2009, and December 31, 2011. Obesity prevalence was estimated among census tracts with >=10 observations in Denver County census tracts during the study period. We calculated the Moran's I statistic to test for spatial autocorrelation across census tracts, and mapped crude and EB obesity prevalence across geographic areas.
Results: In Denver County, there were 143 census tracts with 10 or more observations, representing a total of 97,710 adults with a valid BMI. The crude obesity prevalence for adults in Denver County was 29.8 percent (95% CI 28.4-31.1%) and ranged from 12.8 to 45.2 percent across individual census tracts. EB obesity prevalence was 30.2 percent (95% CI 28.9-31.5%) and ranged from 15.3 to 44.3 percent across census tracts. Statistical tests using the Moran's I statistic suggest adult obesity prevalence in Denver County was distributed in a non-random pattern. Clusters of EB obesity estimates were highly significant (alpha=0.05) in neighboring census tracts. Concentrations of obesity estimates were primarily in the west and north in Denver County.
Conclusions: Statistical tests reveal adult obesity prevalence exhibit spatial autocorrelation in Denver County at the census tract level. EB estimates for obesity prevalence can be used to control for spatial autocorrelation between neighboring census tracts and may produce less biased estimates of obesity prevalence.
目的:测量跨地理区域的肥胖患病率应考虑环境和社会经济因素,这些因素有助于空间自相关,相邻区域估计值的依赖性,以减轻测量中的偏差和假设检验中I型错误的风险。跨地理区域观测值之间的依赖性违反了统计独立性假设,并可能导致有偏差的估计。经验贝叶斯(EB)估计减少了空间自相关估计的可变性,这限制了总体均方误差和控制样本偏差。方法:利用科罗拉多州身体质量指数(BMI)监测系统,利用2009年1月1日至2011年12月31日的患者电子健康记录数据,对成人(≥18岁)肥胖(BMI≥30 kg m2)测量结果的空间自相关性进行建模。在研究期间,对丹佛县人口普查区中>=10个观察值的人口普查区进行肥胖患病率估计。我们计算了Moran's I统计量来检验人口普查区的空间自相关性,并绘制了不同地理区域的粗肥胖和EB肥胖患病率。结果:在丹佛县,有143个人口普查区有10个或更多的观察,代表了97,710名具有有效BMI的成年人。丹佛县成人粗肥胖患病率为29.8% (95% CI 28.4-31.1%),在各个人口普查区的范围为12.8%至45.2%。EB型肥胖患病率为30.2% (95% CI 28.9-31.5%),在人口普查区的范围为15.3%至44.3%。使用Moran's I统计数据的统计测试表明,丹佛县的成人肥胖患病率呈非随机分布模式。在邻近的人口普查区,EB肥胖估计的聚类非常显著(α =0.05)。肥胖估计主要集中在丹佛县的西部和北部。结论:统计检验显示丹佛县成人肥胖患病率在人口普查区水平上呈现空间自相关。肥胖患病率的EB估计值可用于控制邻近人口普查区之间的空间自相关性,并可能产生偏差较小的肥胖患病率估计值。

 求助内容:
求助内容: 应助结果提醒方式:


