{"title":"iQuant2: Software for Rapid and Quantitative Imaging Using Laser Ablation-ICP Mass Spectrometry.","authors":"Toshihiro Suzuki, Shuhei Sakata, Yoshiki Makino, Hideyuki Obayashi, Seiya Ohara, Kentaro Hattori, Takafumi Hirata","doi":"10.5702/massspectrometry.A0065","DOIUrl":null,"url":null,"abstract":"<p><p>We report on the development of a software program named iQuant2 which creates visual images from two-dimensional signal intensity data obtained by a laser ablation-ICP-mass spectrometry (LA-ICPMS) technique. Time-resolved signal intensity profiles can be converted to position resolved signal intensity data based on the rastering rate (μm s<sup>-1</sup>) of the laser ablation. Background signal intensities obtained without laser ablation (gas blank) are used as the background, and all of the blank-subtracted intensity data can be used for the imaging analysis. With this software, deformation of the created image can be corrected visually on a PC screen. The line profile analysis between the user-selected points can be observed using the iQuant2 software. To accomplish this, data points on the profile line were automatically calculated based on the interpolation between the analysis points. The resulting imaging data can be exported and stored as JPEG, BMP or PNG formats for further processing. Moreover, a semi-quantitative analysis can be made based on the coupling of the external correction of the RSF (relative sensitivity factor) using NIST SRM610 with normalization of the corrected signal intensity data being 100%. The calculated abundance data for major elements are in reasonable agreement with the values obtained by electron probe micro analyzer (EPMA). With the software developed in this study, both the rapid imaging and semi-quantitative determinations can be made.</p>","PeriodicalId":18243,"journal":{"name":"Mass spectrometry","volume":"7 1","pages":"A0065"},"PeriodicalIF":0.0000,"publicationDate":"2018-01-01","publicationTypes":"Journal Article","fieldsOfStudy":null,"isOpenAccess":false,"openAccessPdf":"https://sci-hub-pdf.com/10.5702/massspectrometry.A0065","citationCount":"25","resultStr":null,"platform":"Semanticscholar","paperid":null,"PeriodicalName":"Mass spectrometry","FirstCategoryId":"1085","ListUrlMain":"https://doi.org/10.5702/massspectrometry.A0065","RegionNum":0,"RegionCategory":null,"ArticlePicture":[],"TitleCN":null,"AbstractTextCN":null,"PMCID":null,"EPubDate":"2018/3/1 0:00:00","PubModel":"Epub","JCR":"Q3","JCRName":"Physics and Astronomy","Score":null,"Total":0}
引用次数: 25
Abstract
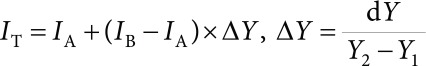
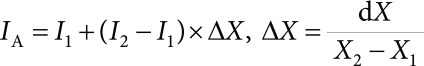
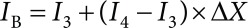
We report on the development of a software program named iQuant2 which creates visual images from two-dimensional signal intensity data obtained by a laser ablation-ICP-mass spectrometry (LA-ICPMS) technique. Time-resolved signal intensity profiles can be converted to position resolved signal intensity data based on the rastering rate (μm s-1) of the laser ablation. Background signal intensities obtained without laser ablation (gas blank) are used as the background, and all of the blank-subtracted intensity data can be used for the imaging analysis. With this software, deformation of the created image can be corrected visually on a PC screen. The line profile analysis between the user-selected points can be observed using the iQuant2 software. To accomplish this, data points on the profile line were automatically calculated based on the interpolation between the analysis points. The resulting imaging data can be exported and stored as JPEG, BMP or PNG formats for further processing. Moreover, a semi-quantitative analysis can be made based on the coupling of the external correction of the RSF (relative sensitivity factor) using NIST SRM610 with normalization of the corrected signal intensity data being 100%. The calculated abundance data for major elements are in reasonable agreement with the values obtained by electron probe micro analyzer (EPMA). With the software developed in this study, both the rapid imaging and semi-quantitative determinations can be made.

 求助内容:
求助内容: 应助结果提醒方式:


