{"title":"prepare_taxa_charts.py: A Python program to automate generation of publication ready taxonomic pie chart images from QIIME","authors":"Vijay Lakhujani, Chandan Badapanda","doi":"10.1016/j.gdata.2017.03.009","DOIUrl":null,"url":null,"abstract":"<div><p>QIIME (Quantitative Insights Into Microbial Ecology) is one of the most popular open-source bioinformatics suite for performing metagenome, 16S rRNA amplicon and Internal Transcribed Spacer (ITS) data analysis. Although, it is very comprehensive and powerful tool, it lacks a method to provide publication ready taxonomic pie charts. The script <em>plot_taxa_summary</em>.<em>py</em> bundled with QIIME generate a html file and a folder containing taxonomic pie chart and legend as separate images. The images have randomly generated alphanumeric names. Therefore, it is difficult to associate the pie chart with the legend and the corresponding sample identifier. Even if the option to have the legend within the html file is selected while executing <em>plot_taxa_summary</em>.<em>py</em>, it is very tedious to crop a complete image (having both the pie chart and the legend) due to unequal image sizes. It requires a lot of time to manually prepare the pie charts for multiple samples for publication purpose. Moreover, there are chances of error while identifying the pie chart and legend pair due to random alphanumeric names of the images. To bypass all these bottlenecks and make this process efficient, we have developed a python based program, <em>prepare_taxa_charts</em>.<em>py</em>, to automate the renaming, cropping and merging of taxonomic pie chart and corresponding legend image into a single, good quality publication ready image. This program not only augments the functionality of <em>plot_taxa_summary</em>.<em>py</em> but is also very fast in terms of CPU time and user friendly.</p></div>","PeriodicalId":56340,"journal":{"name":"Genomics Data","volume":"12 ","pages":"Pages 97-101"},"PeriodicalIF":0.0000,"publicationDate":"2017-06-01","publicationTypes":"Journal Article","fieldsOfStudy":null,"isOpenAccess":false,"openAccessPdf":"https://sci-hub-pdf.com/10.1016/j.gdata.2017.03.009","citationCount":"1","resultStr":null,"platform":"Semanticscholar","paperid":null,"PeriodicalName":"Genomics Data","FirstCategoryId":"1085","ListUrlMain":"https://www.sciencedirect.com/science/article/pii/S2213596016302070","RegionNum":0,"RegionCategory":null,"ArticlePicture":[],"TitleCN":null,"AbstractTextCN":null,"PMCID":null,"EPubDate":"","PubModel":"","JCR":"","JCRName":"","Score":null,"Total":0}
引用次数: 1
Abstract
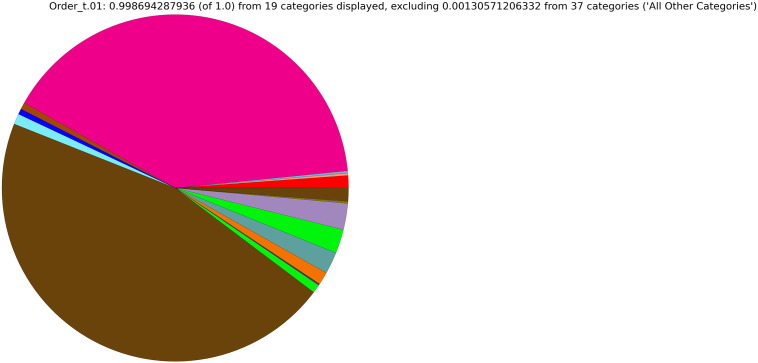
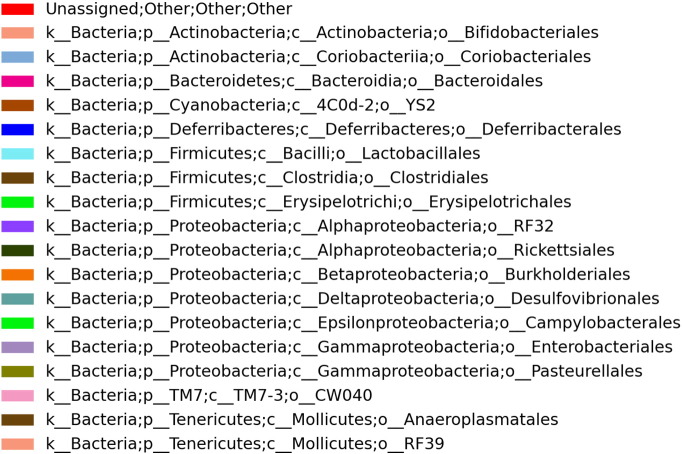
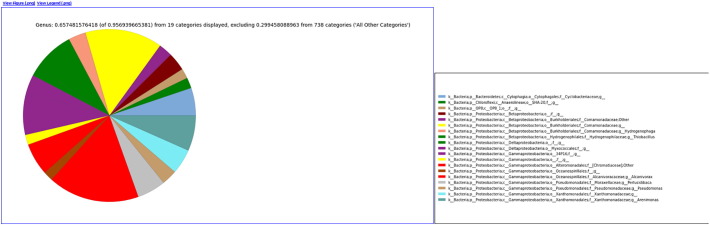
QIIME (Quantitative Insights Into Microbial Ecology) is one of the most popular open-source bioinformatics suite for performing metagenome, 16S rRNA amplicon and Internal Transcribed Spacer (ITS) data analysis. Although, it is very comprehensive and powerful tool, it lacks a method to provide publication ready taxonomic pie charts. The script plot_taxa_summary.py bundled with QIIME generate a html file and a folder containing taxonomic pie chart and legend as separate images. The images have randomly generated alphanumeric names. Therefore, it is difficult to associate the pie chart with the legend and the corresponding sample identifier. Even if the option to have the legend within the html file is selected while executing plot_taxa_summary.py, it is very tedious to crop a complete image (having both the pie chart and the legend) due to unequal image sizes. It requires a lot of time to manually prepare the pie charts for multiple samples for publication purpose. Moreover, there are chances of error while identifying the pie chart and legend pair due to random alphanumeric names of the images. To bypass all these bottlenecks and make this process efficient, we have developed a python based program, prepare_taxa_charts.py, to automate the renaming, cropping and merging of taxonomic pie chart and corresponding legend image into a single, good quality publication ready image. This program not only augments the functionality of plot_taxa_summary.py but is also very fast in terms of CPU time and user friendly.

 求助内容:
求助内容: 应助结果提醒方式:


