Izaskun Mallona, Anna Díez-Villanueva, Miguel A Peinado
{"title":"Methylation plotter: a web tool for dynamic visualization of DNA methylation data.","authors":"Izaskun Mallona, Anna Díez-Villanueva, Miguel A Peinado","doi":"10.1186/1751-0473-9-11","DOIUrl":null,"url":null,"abstract":"<p><p>Methylation plotter is a Web tool that allows the visualization of methylation data in a user-friendly manner and with publication-ready quality. The user is asked to introduce a file containing the methylation status of a genomic region. This file can contain up to 100 samples and 100 CpGs. Optionally, the user can assign a group for each sample (i.e. whether a sample is a tumoral or normal tissue). After the data upload, the tool produces different graphical representations of the results following the most commonly used styles to display this type of data. They include an interactive plot that summarizes the status of every CpG site and for every sample in lollipop or grid styles. Methylation values ranging from 0 (unmethylated) to 1 (fully methylated) are represented using a gray color gradient. A practical feature of the tool allows the user to choose from different types of arrangement of the samples in the display: for instance, sorting by overall methylation level, by group, by unsupervised clustering or just following the order in which data were entered. In addition to the detailed plot, Methylation plotter produces a methylation profile plot that summarizes the status of the scrutinized region, a boxplot that sums up the differences between groups (if any) and a dendrogram that classifies the data by unsupervised clustering. Coupled with this analysis, descriptive statistics and testing for differences at both CpG and group levels are provided. The implementation is based in R/shiny, providing a highly dynamic user interface that generates quality graphics without the need of writing R code. Methylation plotter is freely available at http://gattaca.imppc.org:3838/methylation_plotter/. </p>","PeriodicalId":35052,"journal":{"name":"Source Code for Biology and Medicine","volume":"9 ","pages":"11"},"PeriodicalIF":0.0000,"publicationDate":"2014-06-07","publicationTypes":"Journal Article","fieldsOfStudy":null,"isOpenAccess":false,"openAccessPdf":"https://sci-hub-pdf.com/10.1186/1751-0473-9-11","citationCount":"55","resultStr":null,"platform":"Semanticscholar","paperid":null,"PeriodicalName":"Source Code for Biology and Medicine","FirstCategoryId":"1085","ListUrlMain":"https://doi.org/10.1186/1751-0473-9-11","RegionNum":0,"RegionCategory":null,"ArticlePicture":[],"TitleCN":null,"AbstractTextCN":null,"PMCID":null,"EPubDate":"2014/1/1 0:00:00","PubModel":"eCollection","JCR":"Q2","JCRName":"Decision Sciences","Score":null,"Total":0}
引用次数: 55
Abstract
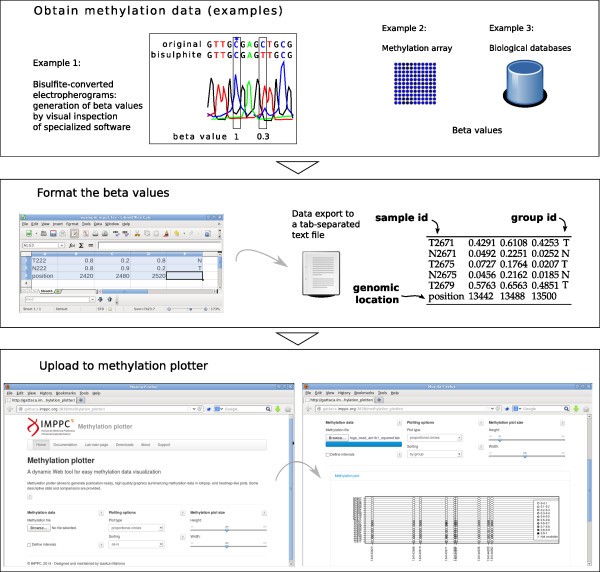
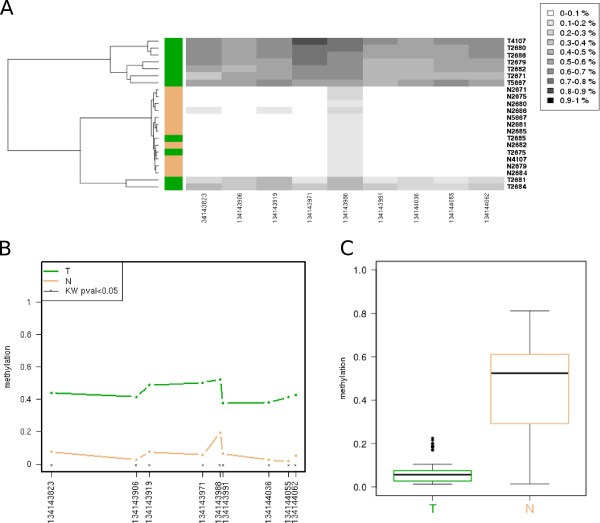
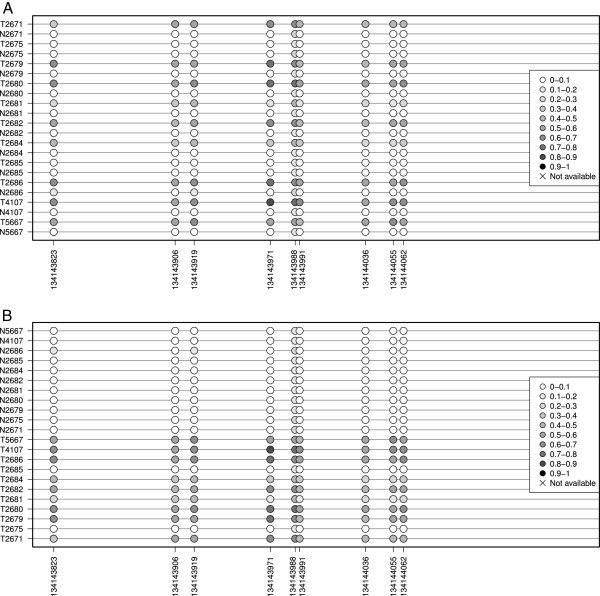
Methylation plotter is a Web tool that allows the visualization of methylation data in a user-friendly manner and with publication-ready quality. The user is asked to introduce a file containing the methylation status of a genomic region. This file can contain up to 100 samples and 100 CpGs. Optionally, the user can assign a group for each sample (i.e. whether a sample is a tumoral or normal tissue). After the data upload, the tool produces different graphical representations of the results following the most commonly used styles to display this type of data. They include an interactive plot that summarizes the status of every CpG site and for every sample in lollipop or grid styles. Methylation values ranging from 0 (unmethylated) to 1 (fully methylated) are represented using a gray color gradient. A practical feature of the tool allows the user to choose from different types of arrangement of the samples in the display: for instance, sorting by overall methylation level, by group, by unsupervised clustering or just following the order in which data were entered. In addition to the detailed plot, Methylation plotter produces a methylation profile plot that summarizes the status of the scrutinized region, a boxplot that sums up the differences between groups (if any) and a dendrogram that classifies the data by unsupervised clustering. Coupled with this analysis, descriptive statistics and testing for differences at both CpG and group levels are provided. The implementation is based in R/shiny, providing a highly dynamic user interface that generates quality graphics without the need of writing R code. Methylation plotter is freely available at http://gattaca.imppc.org:3838/methylation_plotter/.
期刊介绍:
Source Code for Biology and Medicine is a peer-reviewed open access, online journal that publishes articles on source code employed over a wide range of applications in biology and medicine. The journal"s aim is to publish source code for distribution and use in the public domain in order to advance biological and medical research. Through this dissemination, it may be possible to shorten the time required for solving certain computational problems for which there is limited source code availability or resources.

 求助内容:
求助内容: 应助结果提醒方式:


