{"title":"Superplot3d: an open source GUI tool for 3d trajectory visualisation and elementary processing.","authors":"Luke J Whitehorn, Frances M Hawkes, Ian An Dublon","doi":"10.1186/1751-0473-8-19","DOIUrl":null,"url":null,"abstract":"<p><p>When acquiring simple three-dimensional (3d) trajectory data it is common to accumulate large coordinate data sets. In order to examine integrity and consistency of object tracking, it is often necessary to rapidly visualise these data. Ordinarily, to achieve this the user must either execute 3d plotting functions in a numerical computing environment or manually inspect data in two dimensions, plotting each individual axis.Superplot3d is an open source MATLAB script which takes tab delineated Cartesian data points in the form x, y, z and time and generates an instant visualization of the object's trajectory in free-rotational three dimensions. Whole trajectories may be instantly presented, allowing for rapid inspection. Executable from the MATLAB command line (or deployable as a compiled standalone application) superplot3d also provides simple GUI controls to obtain rudimentary trajectory information, allow specific visualization of trajectory sections and perform elementary processing.Superplot3d thus provides a framework for non-programmers and programmers alike, to recreate recently acquired 3d object trajectories in rotatable 3d space. It is intended, via the use of a preference driven menu to be flexible and work with output from multiple tracking software systems. Source code and accompanying GUIDE .fig files are provided for deployment and further development. </p>","PeriodicalId":35052,"journal":{"name":"Source Code for Biology and Medicine","volume":"8 1","pages":"19"},"PeriodicalIF":0.0000,"publicationDate":"2013-09-30","publicationTypes":"Journal Article","fieldsOfStudy":null,"isOpenAccess":false,"openAccessPdf":"https://sci-hub-pdf.com/10.1186/1751-0473-8-19","citationCount":"2","resultStr":null,"platform":"Semanticscholar","paperid":null,"PeriodicalName":"Source Code for Biology and Medicine","FirstCategoryId":"1085","ListUrlMain":"https://doi.org/10.1186/1751-0473-8-19","RegionNum":0,"RegionCategory":null,"ArticlePicture":[],"TitleCN":null,"AbstractTextCN":null,"PMCID":null,"EPubDate":"","PubModel":"","JCR":"Q2","JCRName":"Decision Sciences","Score":null,"Total":0}
引用次数: 2
Abstract
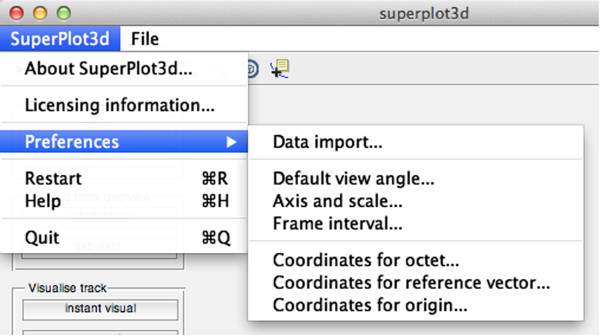
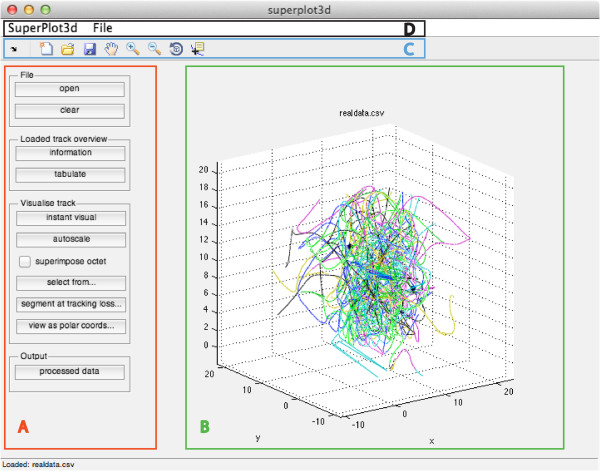
When acquiring simple three-dimensional (3d) trajectory data it is common to accumulate large coordinate data sets. In order to examine integrity and consistency of object tracking, it is often necessary to rapidly visualise these data. Ordinarily, to achieve this the user must either execute 3d plotting functions in a numerical computing environment or manually inspect data in two dimensions, plotting each individual axis.Superplot3d is an open source MATLAB script which takes tab delineated Cartesian data points in the form x, y, z and time and generates an instant visualization of the object's trajectory in free-rotational three dimensions. Whole trajectories may be instantly presented, allowing for rapid inspection. Executable from the MATLAB command line (or deployable as a compiled standalone application) superplot3d also provides simple GUI controls to obtain rudimentary trajectory information, allow specific visualization of trajectory sections and perform elementary processing.Superplot3d thus provides a framework for non-programmers and programmers alike, to recreate recently acquired 3d object trajectories in rotatable 3d space. It is intended, via the use of a preference driven menu to be flexible and work with output from multiple tracking software systems. Source code and accompanying GUIDE .fig files are provided for deployment and further development.
在获取简单的三维轨迹数据时,通常需要积累大量的坐标数据集。为了检验目标跟踪的完整性和一致性,通常需要对这些数据进行快速可视化。通常,要实现这一点,用户必须在数值计算环境中执行3d绘图功能,或者手动检查二维数据,绘制每个单独的轴。Superplot3d是一个开源的MATLAB脚本,它以x, y, z和时间的形式绘制笛卡尔数据点,并在自由旋转的三维空间中生成对象轨迹的即时可视化。整个轨迹可以立即呈现,允许快速检查。superplot3d还提供了简单的GUI控件来获取基本的轨迹信息,允许对轨迹部分进行特定的可视化,并执行基本的处理。因此,Superplot3d为非程序员和程序员提供了一个框架,可以在可旋转的3d空间中重新创建最近获得的3d物体轨迹。它的目的是,通过使用首选项驱动的菜单是灵活的,并与多个跟踪软件系统的输出工作。提供了源代码和附带的GUIDE .fig文件,用于部署和进一步开发。
期刊介绍:
Source Code for Biology and Medicine is a peer-reviewed open access, online journal that publishes articles on source code employed over a wide range of applications in biology and medicine. The journal"s aim is to publish source code for distribution and use in the public domain in order to advance biological and medical research. Through this dissemination, it may be possible to shorten the time required for solving certain computational problems for which there is limited source code availability or resources.


 求助内容:
求助内容: 应助结果提醒方式:


