{"title":"Fundal height growth curve for thai women.","authors":"Jirawan Deeluea, Supatra Sirichotiyakul, Sawaek Weerakiet, Renu Buntha, Chamaiporn Tawichasri, Jayanton Patumanond","doi":"10.1155/2013/463598","DOIUrl":null,"url":null,"abstract":"<p><p>Objectives. To develop fundal height (FH) growth curve from normal singleton pregnancy based on last menstrual period (LMP) and/or ultrasound dating for women in the northern part of Thailand. Methods. A retrospective time-series study was conducted at four hospitals in the upper northern part of Thailand between January 2009 and March 2011. FH from 20 to 40 weeks was measured in centimeters. The FH growth curve was presented as smoothed function of the 10th, 50th, and 90th percentiles, which were derived from a regression model fitted by a multilevel model for continuous data. Results. FH growth curve was derived from 7,523 measurements of 1,038 women. Gestational age was calculated from LMP in 648 women and ultrasound in 390 women. The FH increased from 19.1 cm at 20 weeks to 35.4 cm at 40 weeks. The maximum increase of 1.0 cm/wk was observed between 20 and 32 weeks, declining to 0.7 cm/wk between 33 and 36 weeks and 0.3 cm/wk between 37 and 40 weeks. A quadratic regression equation was FH (cm) = -19.7882 + 2.438157 GA (wk) - 0.0262178 GA(2) (wk) (R-squared = 0.85). Conclusions. A demographically specific FH growth curve may be an appropriate tool for monitoring and screening abnormal intrauterine growth.</p>","PeriodicalId":73520,"journal":{"name":"ISRN obstetrics and gynecology","volume":"2013 ","pages":"463598"},"PeriodicalIF":0.0000,"publicationDate":"2013-04-15","publicationTypes":"Journal Article","fieldsOfStudy":null,"isOpenAccess":false,"openAccessPdf":"https://sci-hub-pdf.com/10.1155/2013/463598","citationCount":"11","resultStr":null,"platform":"Semanticscholar","paperid":null,"PeriodicalName":"ISRN obstetrics and gynecology","FirstCategoryId":"1085","ListUrlMain":"https://doi.org/10.1155/2013/463598","RegionNum":0,"RegionCategory":null,"ArticlePicture":[],"TitleCN":null,"AbstractTextCN":null,"PMCID":null,"EPubDate":"2013/1/1 0:00:00","PubModel":"Print","JCR":"","JCRName":"","Score":null,"Total":0}
引用次数: 11
Abstract
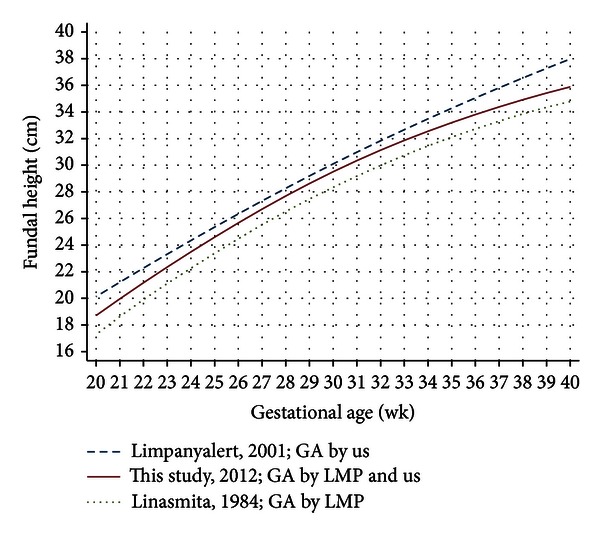
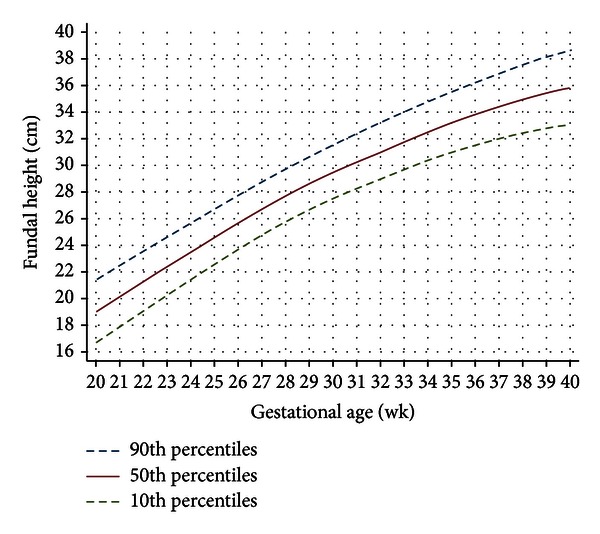
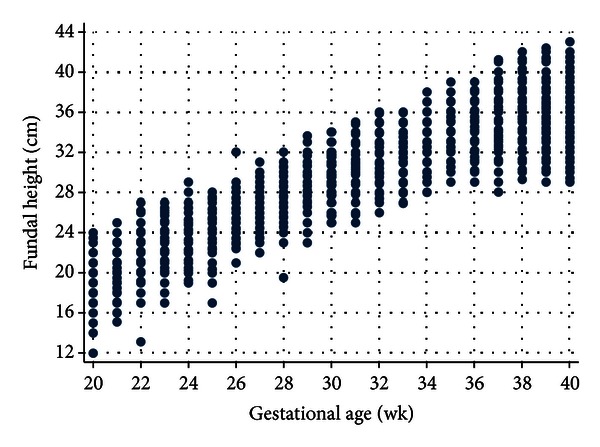
Objectives. To develop fundal height (FH) growth curve from normal singleton pregnancy based on last menstrual period (LMP) and/or ultrasound dating for women in the northern part of Thailand. Methods. A retrospective time-series study was conducted at four hospitals in the upper northern part of Thailand between January 2009 and March 2011. FH from 20 to 40 weeks was measured in centimeters. The FH growth curve was presented as smoothed function of the 10th, 50th, and 90th percentiles, which were derived from a regression model fitted by a multilevel model for continuous data. Results. FH growth curve was derived from 7,523 measurements of 1,038 women. Gestational age was calculated from LMP in 648 women and ultrasound in 390 women. The FH increased from 19.1 cm at 20 weeks to 35.4 cm at 40 weeks. The maximum increase of 1.0 cm/wk was observed between 20 and 32 weeks, declining to 0.7 cm/wk between 33 and 36 weeks and 0.3 cm/wk between 37 and 40 weeks. A quadratic regression equation was FH (cm) = -19.7882 + 2.438157 GA (wk) - 0.0262178 GA(2) (wk) (R-squared = 0.85). Conclusions. A demographically specific FH growth curve may be an appropriate tool for monitoring and screening abnormal intrauterine growth.

 求助内容:
求助内容: 应助结果提醒方式:


