Siu-Wai Leung, John Lee, Chris Johnson, David Robertson
{"title":"Design preferences and cognitive styles: experimentation by automated website synthesis.","authors":"Siu-Wai Leung, John Lee, Chris Johnson, David Robertson","doi":"10.1186/1759-4499-4-2","DOIUrl":null,"url":null,"abstract":"<p><strong>Background: </strong>This article aims to demonstrate computational synthesis of Web-based experiments in undertaking experimentation on relationships among the participants' design preference, rationale, and cognitive test performance. The exemplified experiments were computationally synthesised, including the websites as materials, experiment protocols as methods, and cognitive tests as protocol modules. This work also exemplifies the use of a website synthesiser as an essential instrument enabling the participants to explore different possible designs, which were generated on the fly, before selection of preferred designs.</p><p><strong>Methods: </strong>The participants were given interactive tree and table generators so that they could explore some different ways of presenting causality information in tables and trees as the visualisation formats. The participants gave their preference ratings for the available designs, as well as their rationale (criteria) for their design decisions. The participants were also asked to take four cognitive tests, which focus on the aspects of visualisation and analogy-making. The relationships among preference ratings, rationale, and the results of cognitive tests were analysed by conservative non-parametric statistics including Wilcoxon test, Krustal-Wallis test, and Kendall correlation.</p><p><strong>Results: </strong>In the test, 41 of the total 64 participants preferred graphical (tree-form) to tabular presentation. Despite the popular preference for graphical presentation, the given tabular presentation was generally rated to be easier than graphical presentation to interpret, especially by those who were scored lower in the visualization and analogy-making tests.</p><p><strong>Conclusions: </strong>This piece of evidence helps generate a hypothesis that design preferences are related to specific cognitive abilities. Without the use of computational synthesis, the experiment setup and scientific results would be impractical to obtain.</p>","PeriodicalId":88390,"journal":{"name":"Automated experimentation","volume":"4 1","pages":"2"},"PeriodicalIF":0.0000,"publicationDate":"2012-06-29","publicationTypes":"Journal Article","fieldsOfStudy":null,"isOpenAccess":false,"openAccessPdf":"https://sci-hub-pdf.com/10.1186/1759-4499-4-2","citationCount":"1","resultStr":null,"platform":"Semanticscholar","paperid":null,"PeriodicalName":"Automated experimentation","FirstCategoryId":"1085","ListUrlMain":"https://doi.org/10.1186/1759-4499-4-2","RegionNum":0,"RegionCategory":null,"ArticlePicture":[],"TitleCN":null,"AbstractTextCN":null,"PMCID":null,"EPubDate":"","PubModel":"","JCR":"","JCRName":"","Score":null,"Total":0}
引用次数: 1
Abstract
Background: This article aims to demonstrate computational synthesis of Web-based experiments in undertaking experimentation on relationships among the participants' design preference, rationale, and cognitive test performance. The exemplified experiments were computationally synthesised, including the websites as materials, experiment protocols as methods, and cognitive tests as protocol modules. This work also exemplifies the use of a website synthesiser as an essential instrument enabling the participants to explore different possible designs, which were generated on the fly, before selection of preferred designs.
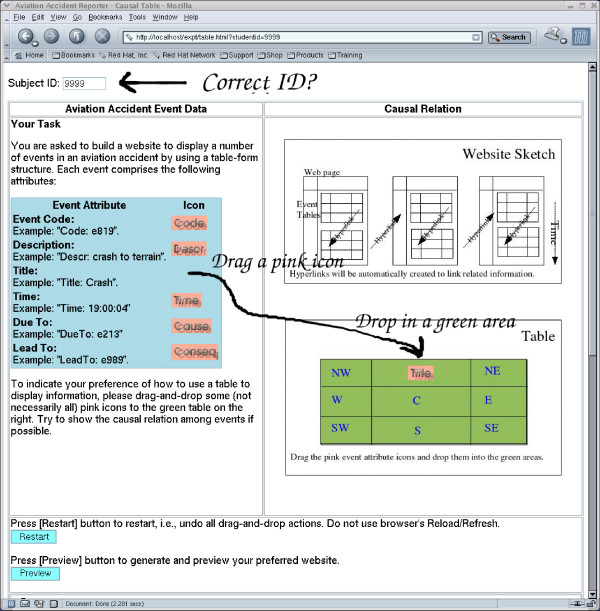
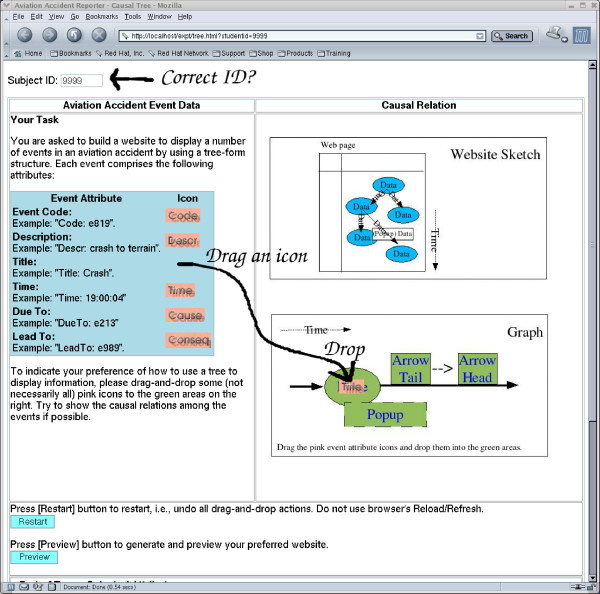
Methods: The participants were given interactive tree and table generators so that they could explore some different ways of presenting causality information in tables and trees as the visualisation formats. The participants gave their preference ratings for the available designs, as well as their rationale (criteria) for their design decisions. The participants were also asked to take four cognitive tests, which focus on the aspects of visualisation and analogy-making. The relationships among preference ratings, rationale, and the results of cognitive tests were analysed by conservative non-parametric statistics including Wilcoxon test, Krustal-Wallis test, and Kendall correlation.
Results: In the test, 41 of the total 64 participants preferred graphical (tree-form) to tabular presentation. Despite the popular preference for graphical presentation, the given tabular presentation was generally rated to be easier than graphical presentation to interpret, especially by those who were scored lower in the visualization and analogy-making tests.
Conclusions: This piece of evidence helps generate a hypothesis that design preferences are related to specific cognitive abilities. Without the use of computational synthesis, the experiment setup and scientific results would be impractical to obtain.

 求助内容:
求助内容: 应助结果提醒方式:


