{"title":"Mapping and managing geographic variation in elective surgeries through user-friendly data presentation: insights from Tuscany region.","authors":"Alessia Caputo, Milena Vainieri, Sabina Nuti","doi":"10.1007/s43999-025-00074-0","DOIUrl":null,"url":null,"abstract":"<p><p>Geographic variation in elective surgical procedures poses challenges to healthcare equity, efficiency, and resource allocation. This study investigates variation in 14 elective surgical procedures performed in Tuscany, Italy, in 2022, focusing on both regional and Local Health Authority levels. Using hospital discharge data, we calculated treatment rates and the Systematic Component of Variation (SCV) to quantify unwarranted variation, applying McPherson et al. (1996)'s thresholds for interpretation. Results revealed substantial differences across procedures, with low SCVs for hip replacement and inguinal hernia repair, and very high SCVs for vein stripping and coronary artery bypass grafting. To support interpretation and governance, we developed a graphical tool that visually represents SCV levels using an intuitive, color-coded format. The tool was designed to reduce the uncertainty healthcare professionals often face when interpreting variation without clear clinical benchmarks, helping them distinguish between acceptable and potentially unwarranted differences. It was presented during the 2023 Tuscan Performance Evaluation System event and pilot-tested in 2025 with 23 healthcare professionals. The tool improved participants' ability to identify the most appropriate level of governance for action and increased confidence in understanding variation patterns. This study offers a replicable model for analyzing variation and demonstrates the value of user-friendly data visualizations in supporting informed, equity-oriented healthcare decisions. Further validation is recommended to assess long-term impact.</p>","PeriodicalId":520076,"journal":{"name":"Research in health services & regions","volume":"4 1","pages":"14"},"PeriodicalIF":0.0000,"publicationDate":"2025-09-17","publicationTypes":"Journal Article","fieldsOfStudy":null,"isOpenAccess":false,"openAccessPdf":"https://www.ncbi.nlm.nih.gov/pmc/articles/PMC12440846/pdf/","citationCount":"0","resultStr":null,"platform":"Semanticscholar","paperid":null,"PeriodicalName":"Research in health services & regions","FirstCategoryId":"1085","ListUrlMain":"https://doi.org/10.1007/s43999-025-00074-0","RegionNum":0,"RegionCategory":null,"ArticlePicture":[],"TitleCN":null,"AbstractTextCN":null,"PMCID":null,"EPubDate":"","PubModel":"","JCR":"","JCRName":"","Score":null,"Total":0}
引用次数: 0
Abstract
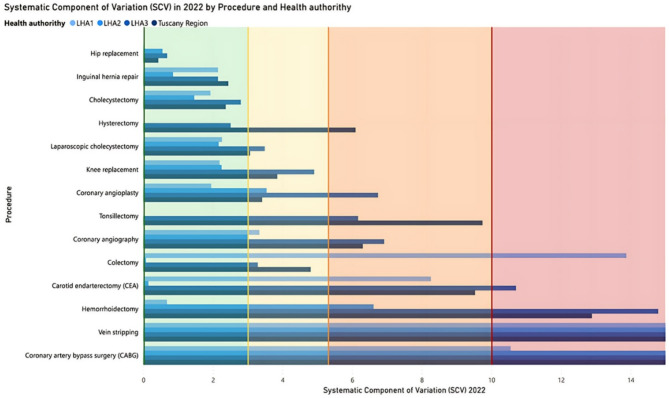
Geographic variation in elective surgical procedures poses challenges to healthcare equity, efficiency, and resource allocation. This study investigates variation in 14 elective surgical procedures performed in Tuscany, Italy, in 2022, focusing on both regional and Local Health Authority levels. Using hospital discharge data, we calculated treatment rates and the Systematic Component of Variation (SCV) to quantify unwarranted variation, applying McPherson et al. (1996)'s thresholds for interpretation. Results revealed substantial differences across procedures, with low SCVs for hip replacement and inguinal hernia repair, and very high SCVs for vein stripping and coronary artery bypass grafting. To support interpretation and governance, we developed a graphical tool that visually represents SCV levels using an intuitive, color-coded format. The tool was designed to reduce the uncertainty healthcare professionals often face when interpreting variation without clear clinical benchmarks, helping them distinguish between acceptable and potentially unwarranted differences. It was presented during the 2023 Tuscan Performance Evaluation System event and pilot-tested in 2025 with 23 healthcare professionals. The tool improved participants' ability to identify the most appropriate level of governance for action and increased confidence in understanding variation patterns. This study offers a replicable model for analyzing variation and demonstrates the value of user-friendly data visualizations in supporting informed, equity-oriented healthcare decisions. Further validation is recommended to assess long-term impact.

 求助内容:
求助内容: 应助结果提醒方式:


