Quality control charts for short or long runs without a training phase. Final part. Performances in the presence of a gradual increase in the mean and slightly autocorrelated data
{"title":"Quality control charts for short or long runs without a training phase. Final part. Performances in the presence of a gradual increase in the mean and slightly autocorrelated data","authors":"Manuel Alvarez-Prieto, Ricardo Páez-Montero","doi":"10.1007/s00769-025-01666-6","DOIUrl":null,"url":null,"abstract":"<div><p>Sometimes analytical laboratories receive requests with a small number of determinations and/or samples, or outside the typical scope of analytical services offered. As a result, they may not have previous data on performance of analytical processes and/or appropriate reference materials. Under these conditions, it is difficult or uneconomical to use classic quality control charts. This is the so-called start-up problem of these control charts. The Quesenberry’s Q charts are appropriated in these situations because they do not require a prior training. This experimental study of Q charts for individual measurements was performed on quality control data for the evaluation of mass fraction of Cr<sub>2</sub>O<sub>3</sub> and Fe in a serpentinite CRM by ICP-OES. The performance of Q charts is discussed when the analytical process presented a gradual increase in the process mean and in the presence of a slight autocorrelation in the raw data. In the first situation, the performances of Q charts for the mean were consistent with the performance of the classical chart for individual measurements, and their sensitivities were comparable. In the second situation, Q charts for the mean also showed a similar response when compared with the chart for individual measurements. They were able to detect the unusual pattern due to autocorrelation in both the short and the long runs. Recommendations on the application of classic and Q charts in the presence of autocorrelation are given. Some other general conclusions about the advantages and disadvantages of Q charts are offered.</p></div>","PeriodicalId":454,"journal":{"name":"Accreditation and Quality Assurance","volume":"30 5","pages":"521 - 529"},"PeriodicalIF":1.0000,"publicationDate":"2025-07-15","publicationTypes":"Journal Article","fieldsOfStudy":null,"isOpenAccess":false,"openAccessPdf":"","citationCount":"0","resultStr":null,"platform":"Semanticscholar","paperid":null,"PeriodicalName":"Accreditation and Quality Assurance","FirstCategoryId":"5","ListUrlMain":"https://link.springer.com/article/10.1007/s00769-025-01666-6","RegionNum":4,"RegionCategory":"工程技术","ArticlePicture":[],"TitleCN":null,"AbstractTextCN":null,"PMCID":null,"EPubDate":"","PubModel":"","JCR":"Q4","JCRName":"CHEMISTRY, ANALYTICAL","Score":null,"Total":0}
引用次数: 0
Abstract
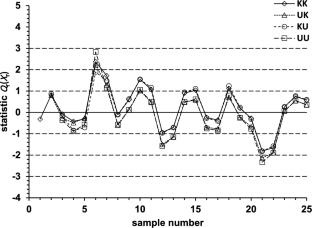
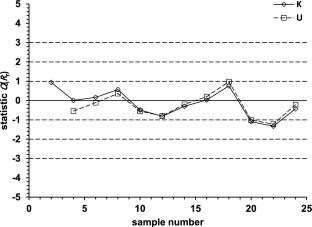
Sometimes analytical laboratories receive requests with a small number of determinations and/or samples, or outside the typical scope of analytical services offered. As a result, they may not have previous data on performance of analytical processes and/or appropriate reference materials. Under these conditions, it is difficult or uneconomical to use classic quality control charts. This is the so-called start-up problem of these control charts. The Quesenberry’s Q charts are appropriated in these situations because they do not require a prior training. This experimental study of Q charts for individual measurements was performed on quality control data for the evaluation of mass fraction of Cr2O3 and Fe in a serpentinite CRM by ICP-OES. The performance of Q charts is discussed when the analytical process presented a gradual increase in the process mean and in the presence of a slight autocorrelation in the raw data. In the first situation, the performances of Q charts for the mean were consistent with the performance of the classical chart for individual measurements, and their sensitivities were comparable. In the second situation, Q charts for the mean also showed a similar response when compared with the chart for individual measurements. They were able to detect the unusual pattern due to autocorrelation in both the short and the long runs. Recommendations on the application of classic and Q charts in the presence of autocorrelation are given. Some other general conclusions about the advantages and disadvantages of Q charts are offered.
期刊介绍:
Accreditation and Quality Assurance has established itself as the leading information and discussion forum for all aspects relevant to quality, transparency and reliability of measurement results in chemical and biological sciences. The journal serves the information needs of researchers, practitioners and decision makers dealing with quality assurance and quality management, including the development and application of metrological principles and concepts such as traceability or measurement uncertainty in the following fields: environment, nutrition, consumer protection, geology, metallurgy, pharmacy, forensics, clinical chemistry and laboratory medicine, and microbiology.

 求助内容:
求助内容: 应助结果提醒方式:


