The Utility of Cervical Vertebral Maturation Method for Staging Skeletal Growth and Curve Progression in Patients with Adolescent Idiopathic Scoliosis.
Samuel Tin Yan Cheung, Garvin Chi Chun Cheung, Jason Pui Yin Cheung, Prudence Wing Hang Cheung
{"title":"The Utility of Cervical Vertebral Maturation Method for Staging Skeletal Growth and Curve Progression in Patients with Adolescent Idiopathic Scoliosis.","authors":"Samuel Tin Yan Cheung, Garvin Chi Chun Cheung, Jason Pui Yin Cheung, Prudence Wing Hang Cheung","doi":"10.2106/JBJS.OA.25.00184","DOIUrl":null,"url":null,"abstract":"<p><strong>Background: </strong>Cervical vertebral maturation (CVM) is a skeletal maturity method that can be assessed routinely on whole spine radiographs to minimize radiation exposure. Originally used in orthodontics, its role in staging adolescent growth spurt and curve progression in adolescent idiopathic scoliosis (AIS) remains unclear. The aim of this study was to investigate growth rates across CVM stages, its cutoff for indicating peak growth (PG) versus growth cessation (GC), and its relationship with coronal curve progression.</p><p><strong>Methods: </strong>One hundred forty-two AIS patients were prospectively followed from Risser stage 0, until growth completion. Longitudinal data collected included arm span (AS), body height (BH), sitting height (SH), coronal Cobb angle, and maturity assessments. CVM was evaluated through its relationship with growth rates and curve progression rates. A total of 1107 spine radiographs corresponding to longitudinal growth rates were analyzed to detect PG and GC in each patient, with predictive accuracy assessed using receiver operating characteristic curve analysis. Curve progression rate of each CVM stage in treatment-naïve patients was plotted against timing to peak curve progression.</p><p><strong>Results: </strong>CVM correlated most with Proximal Femur Maturity Index (PFMI) (τ<sub>b</sub> = 0.662, p < 0.001). CVM stage 3 and 6 showed the respective highest and lowest mean growth rates in SH and AS. CVM stage 3 predicted PG with an area under the curve (AUC) of 0.711 to 0.720. CVM stage 5 predicted GC with AUC of 0.840 to 0.850. CVM stage 3 had the highest curve progression rate (0.45° per month). Peak curve progression occurred 5.8 months after CVM 3 and 9.1 months before CVM 4, lagging behind PG by 6.5 months.</p><p><strong>Conclusions: </strong>CVM stage 3 indicates peak growth, while stage 6 marks growth cessation. In this cohort of AIS patients, GC is more accurately predicted than PG by CVM. Peak curve progression occurred between CVM stage 3 and CVM stage 4.</p><p><strong>Clinical relevance: </strong>This study highlights CVM method's ability in indicating timing of growth cessation. CVM can be used to indicate curve progression beyond peak growth, especially until the point of growth cessation.</p><p><strong>Level of evidence: </strong>Prognostic Level II. See Instructions for Authors for a complete description of levels of evidence.</p>","PeriodicalId":36492,"journal":{"name":"JBJS Open Access","volume":"10 3","pages":""},"PeriodicalIF":3.8000,"publicationDate":"2025-09-08","publicationTypes":"Journal Article","fieldsOfStudy":null,"isOpenAccess":false,"openAccessPdf":"https://www.ncbi.nlm.nih.gov/pmc/articles/PMC12412741/pdf/","citationCount":"0","resultStr":null,"platform":"Semanticscholar","paperid":null,"PeriodicalName":"JBJS Open Access","FirstCategoryId":"1085","ListUrlMain":"https://doi.org/10.2106/JBJS.OA.25.00184","RegionNum":0,"RegionCategory":null,"ArticlePicture":[],"TitleCN":null,"AbstractTextCN":null,"PMCID":null,"EPubDate":"2025/7/1 0:00:00","PubModel":"eCollection","JCR":"Q2","JCRName":"ORTHOPEDICS","Score":null,"Total":0}
引用次数: 0
Abstract
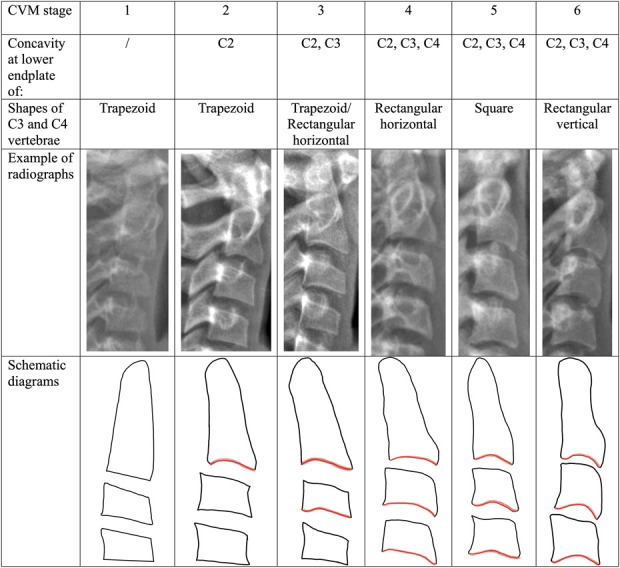
Background: Cervical vertebral maturation (CVM) is a skeletal maturity method that can be assessed routinely on whole spine radiographs to minimize radiation exposure. Originally used in orthodontics, its role in staging adolescent growth spurt and curve progression in adolescent idiopathic scoliosis (AIS) remains unclear. The aim of this study was to investigate growth rates across CVM stages, its cutoff for indicating peak growth (PG) versus growth cessation (GC), and its relationship with coronal curve progression.
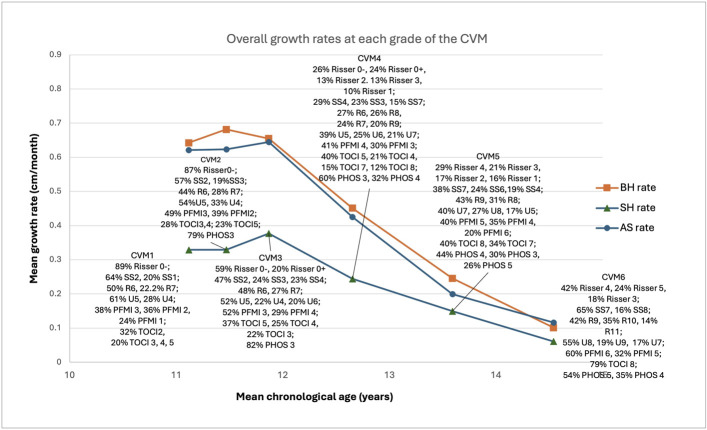
Methods: One hundred forty-two AIS patients were prospectively followed from Risser stage 0, until growth completion. Longitudinal data collected included arm span (AS), body height (BH), sitting height (SH), coronal Cobb angle, and maturity assessments. CVM was evaluated through its relationship with growth rates and curve progression rates. A total of 1107 spine radiographs corresponding to longitudinal growth rates were analyzed to detect PG and GC in each patient, with predictive accuracy assessed using receiver operating characteristic curve analysis. Curve progression rate of each CVM stage in treatment-naïve patients was plotted against timing to peak curve progression.
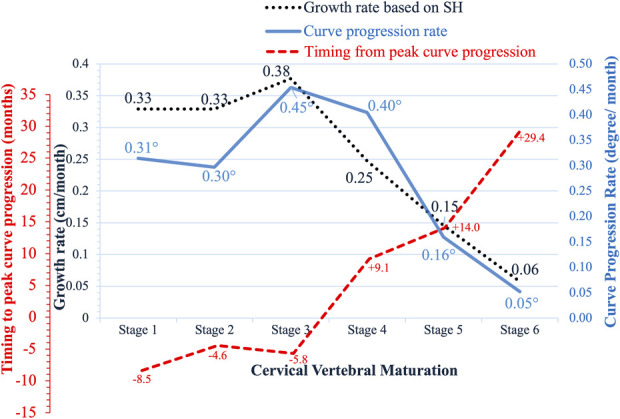
Results: CVM correlated most with Proximal Femur Maturity Index (PFMI) (τb = 0.662, p < 0.001). CVM stage 3 and 6 showed the respective highest and lowest mean growth rates in SH and AS. CVM stage 3 predicted PG with an area under the curve (AUC) of 0.711 to 0.720. CVM stage 5 predicted GC with AUC of 0.840 to 0.850. CVM stage 3 had the highest curve progression rate (0.45° per month). Peak curve progression occurred 5.8 months after CVM 3 and 9.1 months before CVM 4, lagging behind PG by 6.5 months.
Conclusions: CVM stage 3 indicates peak growth, while stage 6 marks growth cessation. In this cohort of AIS patients, GC is more accurately predicted than PG by CVM. Peak curve progression occurred between CVM stage 3 and CVM stage 4.
Clinical relevance: This study highlights CVM method's ability in indicating timing of growth cessation. CVM can be used to indicate curve progression beyond peak growth, especially until the point of growth cessation.
Level of evidence: Prognostic Level II. See Instructions for Authors for a complete description of levels of evidence.

 求助内容:
求助内容: 应助结果提醒方式:


