{"title":"GViNC: an innovative framework for genome graph comparison reveals hidden patterns in the genetic diversity of human populations.","authors":"Venkatesh Kamaraj, Ayam Gupta, Karthik Raman, Manikandan Narayanan, Himanshu Sinha","doi":"10.1093/nargab/lqaf121","DOIUrl":null,"url":null,"abstract":"<p><p>Genome graphs provide a powerful reference structure for representing genetic diversity. Their structure emphasizes the polymorphic regions in a collection of genomes, enabling network-based comparisons of population-level variation. However, current tools are limited in their ability to quantify and compare structural features across large genome graphs. We introduce GViNC, Genome graph Visualization, Navigation, and Comparison, a novel framework that enables partitioning genome graphs into interpretable subgraphs, mapping linear coordinates to graph nodes, and summarizing both local and global structural variation using new metrics for variability, hypervariability, and graph distances. We applied GViNC to multiple pan-genomic and population-specific genome graphs constructed with over 85M variants in 2504 individuals from the 1000 Genomes Project. We found that genomic complexity varied by ancestry and across chromosomes, with rare variants increasing variability by 10-fold and hypervariability by 50-fold. GViNC highlighted key regions of the human genome, such as Human Leukocyte Antigen and DEFB loci, and many previously unreported high-diversity regions, some with population-specific signatures in protein-coding and regulatory genes. By bridging sequence-level variation and graph-level topology, GViNC enables scalable, quantitative exploration of genome structure across populations. GViNC's versatility can aid researchers in extensively investigating the genetic diversity of different cohorts, populations, or species of interest.</p>","PeriodicalId":33994,"journal":{"name":"NAR Genomics and Bioinformatics","volume":"7 3","pages":"lqaf121"},"PeriodicalIF":2.8000,"publicationDate":"2025-09-03","publicationTypes":"Journal Article","fieldsOfStudy":null,"isOpenAccess":false,"openAccessPdf":"https://www.ncbi.nlm.nih.gov/pmc/articles/PMC12408910/pdf/","citationCount":"0","resultStr":null,"platform":"Semanticscholar","paperid":null,"PeriodicalName":"NAR Genomics and Bioinformatics","FirstCategoryId":"1085","ListUrlMain":"https://doi.org/10.1093/nargab/lqaf121","RegionNum":0,"RegionCategory":null,"ArticlePicture":[],"TitleCN":null,"AbstractTextCN":null,"PMCID":null,"EPubDate":"2025/9/1 0:00:00","PubModel":"eCollection","JCR":"Q1","JCRName":"GENETICS & HEREDITY","Score":null,"Total":0}
引用次数: 0
Abstract
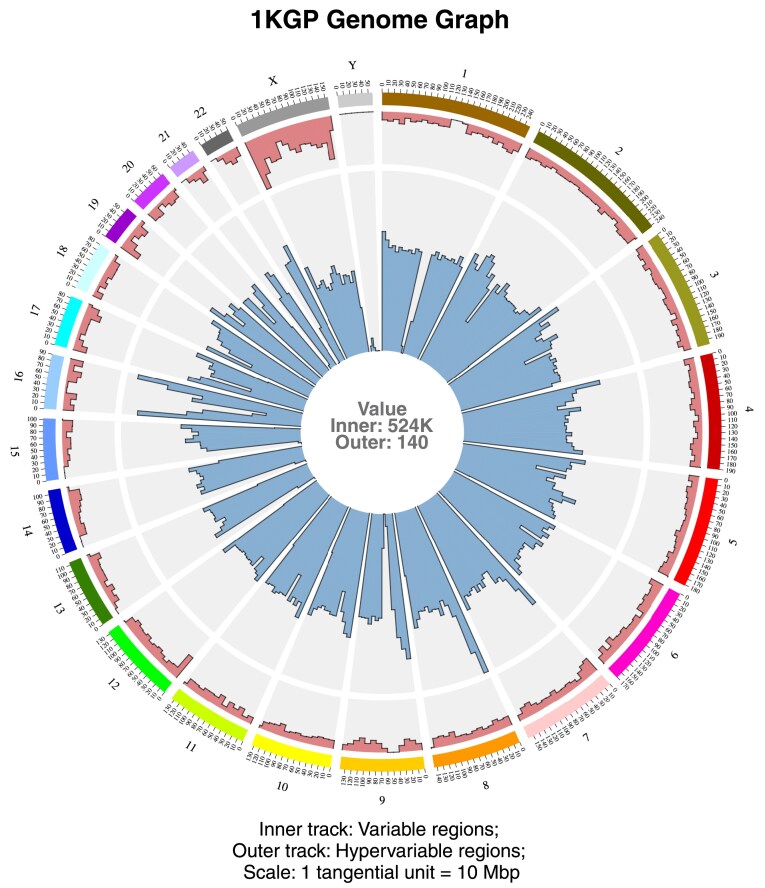
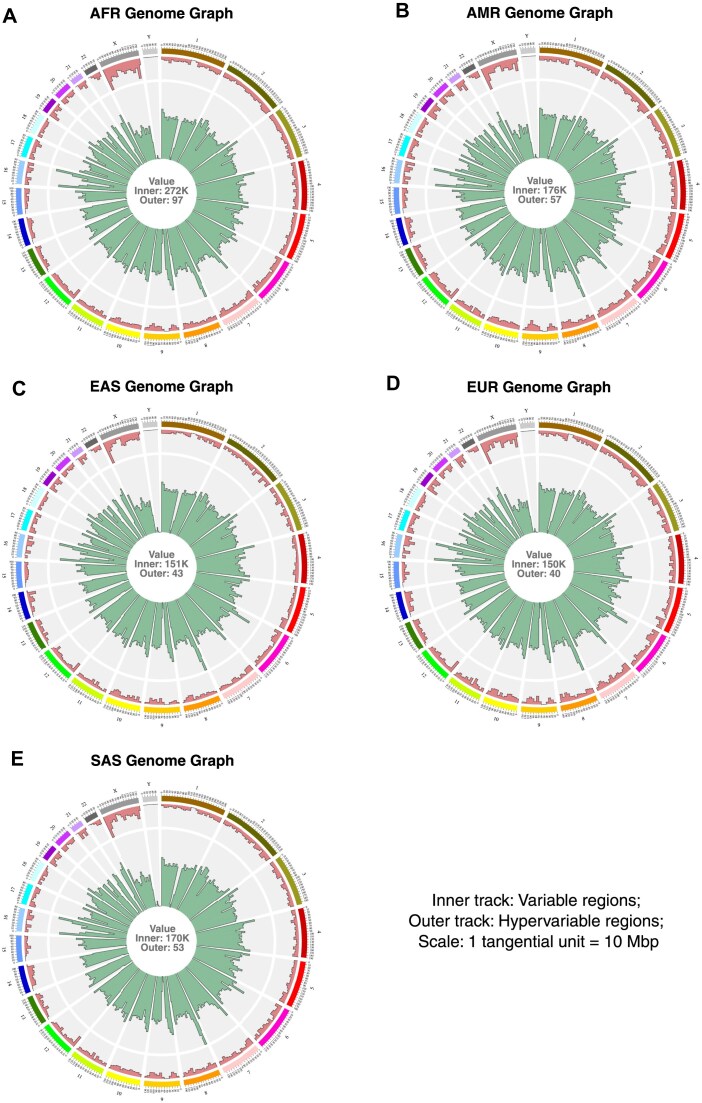
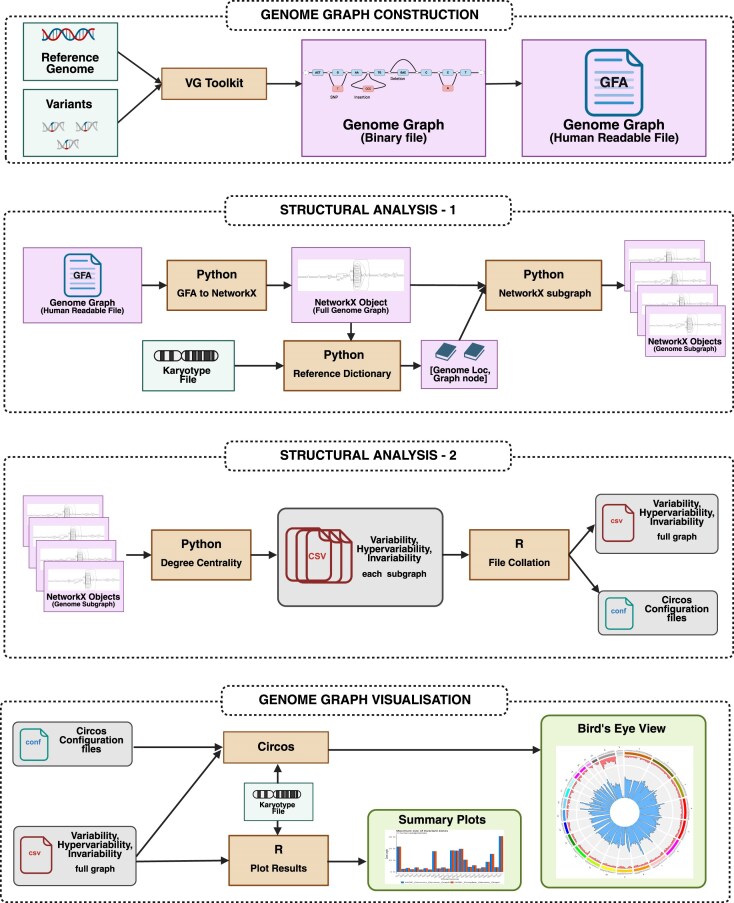
Genome graphs provide a powerful reference structure for representing genetic diversity. Their structure emphasizes the polymorphic regions in a collection of genomes, enabling network-based comparisons of population-level variation. However, current tools are limited in their ability to quantify and compare structural features across large genome graphs. We introduce GViNC, Genome graph Visualization, Navigation, and Comparison, a novel framework that enables partitioning genome graphs into interpretable subgraphs, mapping linear coordinates to graph nodes, and summarizing both local and global structural variation using new metrics for variability, hypervariability, and graph distances. We applied GViNC to multiple pan-genomic and population-specific genome graphs constructed with over 85M variants in 2504 individuals from the 1000 Genomes Project. We found that genomic complexity varied by ancestry and across chromosomes, with rare variants increasing variability by 10-fold and hypervariability by 50-fold. GViNC highlighted key regions of the human genome, such as Human Leukocyte Antigen and DEFB loci, and many previously unreported high-diversity regions, some with population-specific signatures in protein-coding and regulatory genes. By bridging sequence-level variation and graph-level topology, GViNC enables scalable, quantitative exploration of genome structure across populations. GViNC's versatility can aid researchers in extensively investigating the genetic diversity of different cohorts, populations, or species of interest.

 求助内容:
求助内容: 应助结果提醒方式:


