{"title":"Value of grayscale histogram analysis based on ultrasound images in diagnosing sarcopenia.","authors":"Kezhen Qin, Wen Chen, Hengtao Qi, Tiezheng Wang, Yeting Wang, Huawei Zhang, Jianbo Teng","doi":"10.21037/qims-2025-638","DOIUrl":null,"url":null,"abstract":"<p><strong>Background: </strong>Sarcopenia, an age-related condition marked by progressive muscle loss and dysfunction, is a growing clinical and public health challenge. While current diagnostic methods involve limitations in cost, accessibility, and assessment of muscle quality, ultrasound offers a practical alternative. This study examined grayscale histogram analysis of gastrocnemius muscle ultrasound images as a novel quantitative method for diagnosing sarcopenia by evaluating its ability to detect textural changes associated with intramuscular fat infiltration and fibrosis, with the ultimate aim of establishing an accurate, accessible diagnostic approach.</p><p><strong>Methods: </strong>A retrospective case-control study was conducted on 101 patients diagnosed with sarcopenia who were admitted to the Department of Endocrinology at Shandong Provincial Hospital between March and December 2024. Additionally, 101 healthy volunteers who underwent health examinations in our hospital during the same period were recruited as the control group. Grayscale histogram parameters, including the minimum gray value, maximum gray value, median gray value, mean gray value, standard deviation of gray values, skewness, kurtosis, and the gray values corresponding to seven percentile points (quantile 5, quantile 10, quantile 25, quantile 50, quantile 75, quantile 90, quantile 95) were extracted from the ultrasound images of the participants' gastrocnemius muscles. Statistical methods were used to analyze the differences between the sarcopenia and control groups. Receiver operating characteristic (ROC) curves were used to compare the differential diagnostic efficacy of each parameter and their combinations. Linear regression and least absolute shrinkage and selection operator (LASSO) were used to predict the probability of sarcopenia, with model performance evaluated with R<sup>2</sup> values and the mean square error.</p><p><strong>Results: </strong>The grayscale histogram parameters of the gastrocnemius ultrasound images in the sarcopenia group, including the minimum gray value, maximum gray value, median gray value, mean gray value, standard deviation of gray values, and the gray values corresponding to seven percentile points, were significantly higher than those in the control group (P<0.001), while both the skewness and kurtosis were smaller than those in the control group (P<0.001). The gray value corresponding to quantile 75 demonstrated the best diagnostic efficacy [area under the curve (AUC) =0.988, sensitivity =96%, specificity =95%] at a cutoff of 132.5. The LASSO regression model outperformed linear regression (test set: R<sup>2</sup> =0.769 <i>vs.</i> 0.727; mean square error =0.057 <i>vs.</i> 0.068).</p><p><strong>Conclusions: </strong>The grayscale histogram parameters extracted from ultrasound images may be able to quantitatively reflect the differences between patients with sarcopenia and healthy individuals to some extent. Grayscale histogram analysis based on ultrasound images could be valuable for the diagnosis of sarcopenia.</p>","PeriodicalId":54267,"journal":{"name":"Quantitative Imaging in Medicine and Surgery","volume":"15 9","pages":"7885-7895"},"PeriodicalIF":2.3000,"publicationDate":"2025-09-01","publicationTypes":"Journal Article","fieldsOfStudy":null,"isOpenAccess":false,"openAccessPdf":"https://www.ncbi.nlm.nih.gov/pmc/articles/PMC12397623/pdf/","citationCount":"0","resultStr":null,"platform":"Semanticscholar","paperid":null,"PeriodicalName":"Quantitative Imaging in Medicine and Surgery","FirstCategoryId":"3","ListUrlMain":"https://doi.org/10.21037/qims-2025-638","RegionNum":2,"RegionCategory":"医学","ArticlePicture":[],"TitleCN":null,"AbstractTextCN":null,"PMCID":null,"EPubDate":"2025/8/19 0:00:00","PubModel":"Epub","JCR":"Q2","JCRName":"RADIOLOGY, NUCLEAR MEDICINE & MEDICAL IMAGING","Score":null,"Total":0}
引用次数: 0
Abstract
Background: Sarcopenia, an age-related condition marked by progressive muscle loss and dysfunction, is a growing clinical and public health challenge. While current diagnostic methods involve limitations in cost, accessibility, and assessment of muscle quality, ultrasound offers a practical alternative. This study examined grayscale histogram analysis of gastrocnemius muscle ultrasound images as a novel quantitative method for diagnosing sarcopenia by evaluating its ability to detect textural changes associated with intramuscular fat infiltration and fibrosis, with the ultimate aim of establishing an accurate, accessible diagnostic approach.
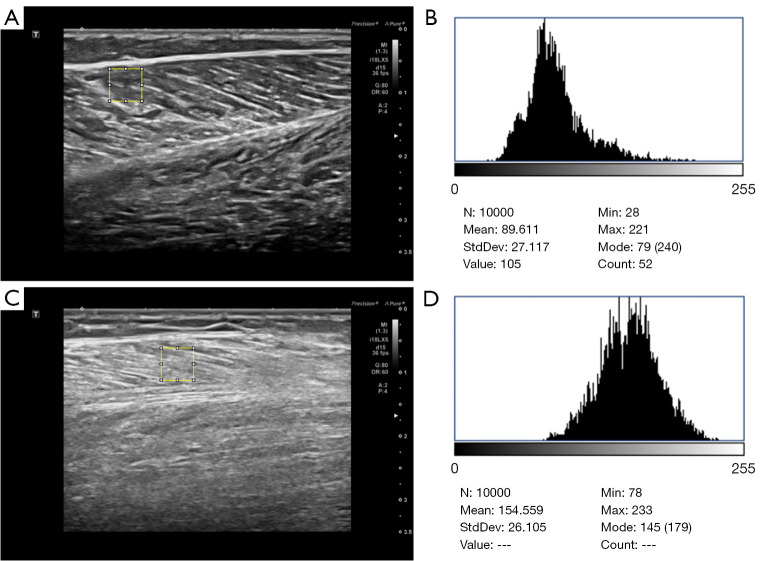
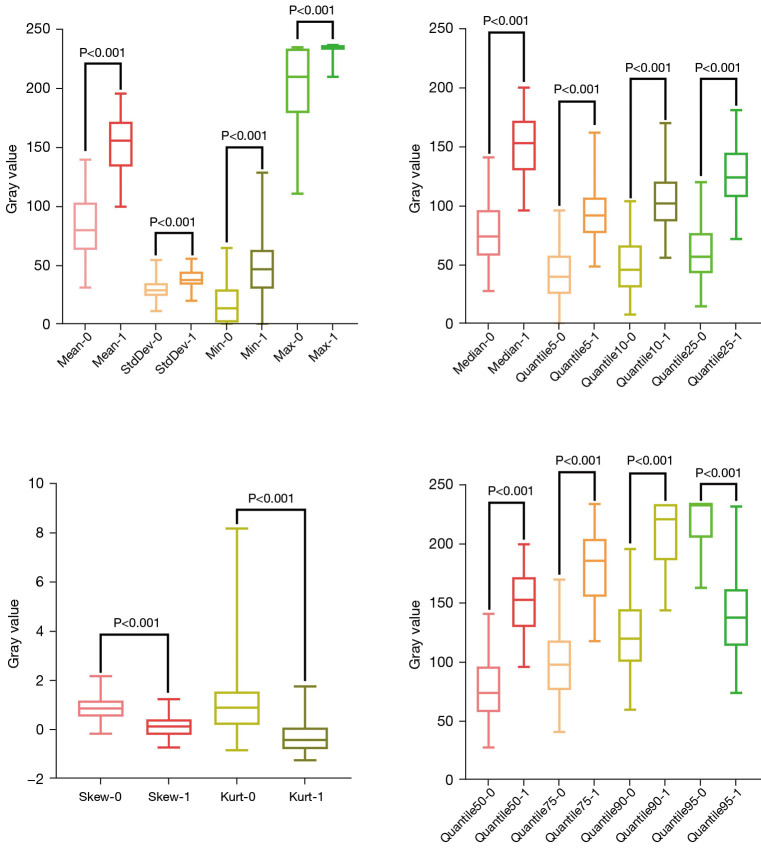
Methods: A retrospective case-control study was conducted on 101 patients diagnosed with sarcopenia who were admitted to the Department of Endocrinology at Shandong Provincial Hospital between March and December 2024. Additionally, 101 healthy volunteers who underwent health examinations in our hospital during the same period were recruited as the control group. Grayscale histogram parameters, including the minimum gray value, maximum gray value, median gray value, mean gray value, standard deviation of gray values, skewness, kurtosis, and the gray values corresponding to seven percentile points (quantile 5, quantile 10, quantile 25, quantile 50, quantile 75, quantile 90, quantile 95) were extracted from the ultrasound images of the participants' gastrocnemius muscles. Statistical methods were used to analyze the differences between the sarcopenia and control groups. Receiver operating characteristic (ROC) curves were used to compare the differential diagnostic efficacy of each parameter and their combinations. Linear regression and least absolute shrinkage and selection operator (LASSO) were used to predict the probability of sarcopenia, with model performance evaluated with R2 values and the mean square error.
Results: The grayscale histogram parameters of the gastrocnemius ultrasound images in the sarcopenia group, including the minimum gray value, maximum gray value, median gray value, mean gray value, standard deviation of gray values, and the gray values corresponding to seven percentile points, were significantly higher than those in the control group (P<0.001), while both the skewness and kurtosis were smaller than those in the control group (P<0.001). The gray value corresponding to quantile 75 demonstrated the best diagnostic efficacy [area under the curve (AUC) =0.988, sensitivity =96%, specificity =95%] at a cutoff of 132.5. The LASSO regression model outperformed linear regression (test set: R2 =0.769 vs. 0.727; mean square error =0.057 vs. 0.068).
Conclusions: The grayscale histogram parameters extracted from ultrasound images may be able to quantitatively reflect the differences between patients with sarcopenia and healthy individuals to some extent. Grayscale histogram analysis based on ultrasound images could be valuable for the diagnosis of sarcopenia.
背景:肌肉减少症是一种以进行性肌肉损失和功能障碍为特征的与年龄相关的疾病,是一个日益增长的临床和公共卫生挑战。虽然目前的诊断方法在成本、可及性和肌肉质量评估方面存在局限性,但超声提供了一种实用的替代方法。本研究将腓肠肌超声图像的灰度直方图分析作为一种新的定量方法,通过评估其检测与肌内脂肪浸润和纤维化相关的肌质变化的能力,来诊断肌肉减少症,最终目的是建立一种准确、方便的诊断方法。方法:对2024年3月至12月山东省立医院内分泌科收治的101例肌肉减少症患者进行回顾性病例对照研究。另外,选取同期在我院体检的101名健康志愿者作为对照组。从受试者腓骨肌超声图像中提取灰度直方图参数,包括最小灰度值、最大灰度值、灰度中位数、平均灰度值、灰度值标准差、偏度、峰度以及7个百分位数(分位数5、分位数10、分位数25、分位数50、分位数75、分位数90、分位数95)对应的灰度值。采用统计学方法分析肌肉减少症组与对照组的差异。采用受试者工作特征(ROC)曲线比较各参数及其组合的鉴别诊断效果。使用线性回归和最小绝对收缩和选择算子(LASSO)预测肌肉减少症的概率,并用R2值和均方误差评估模型的性能。结果:肌少症组腓肠肌超声图像灰度直方图参数,包括最小灰度值、最大灰度值、灰度中位数、平均灰度值、灰度值标准差、7个百分位对应的灰度值均显著高于对照组(P2 =0.769 vs. 0.727;均方误差=0.057 vs. 0.068)。结论:超声图像提取的灰度直方图参数可能在一定程度上定量反映肌肉减少症患者与健康人之间的差异。基于超声图像的灰度直方图分析对肌少症的诊断有一定的价值。
 求助内容:
求助内容: 应助结果提醒方式:


