Estimating crop evapotranspiration using drone imagery, ground canopy temperature, and machine learning techniques
IF 4.5
Q2 ENVIRONMENTAL SCIENCES
Remote Sensing Applications-Society and Environment
Pub Date : 2025-08-01
DOI:10.1016/j.rsase.2025.101661
引用次数: 0
Abstract
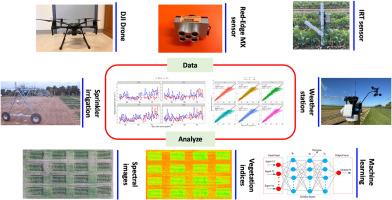
Efficient irrigation management relies on accurately estimating crop evapotranspiration (ETc), yet conventional methods often face limitations, such as cost, spatial coverage, data requirements, and the need for local calibration. This study had two main objectives: 1) to quantify daily ETc of sweet corn (SC) and green beans (GB) using crop water stress index (CWSI) calculated from canopy temperatures (Tc) and crop coefficient (Kc) estimated vegetation indices and 2) to evaluate the potential of machine learning (ML) models in estimating daily ETc and Tc. Irrigation experiments were conducted during the winter seasons of 2020–2021 and 2021–2022 at the University of Florida's Tropical Research and Education Center (TREC), Florida, USA. Networks of above-canopy infrared thermocouples (IRTs) and soil moisture (SM) sensors were used to collect Tc and SM. Multispectral images were also collected using an unmanned aerial vehicle (UAV)-based RedEdge-MX sensor. Sub-hourly changes in SM during dry periods were aggregated to estimate the daily measured ETc of SC and GB. Time series of CWSI were generated from Tc, while Kc was estimated using eleven vegetation indices (VIs) generated from drone imagery. Moreover, four ML models, i.e., CatBoost (CB), Random Forest (RF), k-Nearest Neighbors (kNN), and Extreme Gradient Boosting (XGB), were evaluated for simulating ETc. Six models, i.e., CB, kNN, RF, XGB, Light Gradient Boosting Machine (LGB), and Deep Learning (DL), were also evaluated for simulating the Tc of SC and GB. The results showed that the CWSI approach was acceptable in estimating ETc with an average MAE of 0.90 mm day-1 for SC and 0.62 mm day-1 for GB. Four out of eleven vegetation indices (VIs) demonstrated superior performance in estimating daily ETc, including the Soil Adjusted Vegetation Index (SAVI), Normalized Green-Red Difference Index (NGRDI), Red Edge Normalized Difference Vegetation Index (RENDVI), and NIR-RE normalized difference vegetation index (NIRRENDVI). The ML models captured ETc and Tc with better accuracy. Averaged root mean square error (RMSE) for ETc across the four models was 0.86 mm day-1 for SC and 0.89 mm day-1 for GB. The average RMSE of the ML models for simulating Tc was ±1.1 °C for SC and ±1.5 °C for GB. Overall, CWSI, spectral reflectance-based Kc, and ML models proved to be useful tools for estimating ETc at finer spatial and temporal scales with reasonable accuracy.
利用无人机图像、地面冠层温度和机器学习技术估算作物蒸散量
有效的灌溉管理依赖于对作物蒸散发(ETc)的准确估算,而传统方法往往面临成本、空间覆盖、数据要求和本地校准等限制。本研究有两个主要目标:1)利用作物水分胁迫指数(CWSI)从冠层温度(Tc)和作物系数(Kc)估算植被指数来量化甜玉米(SC)和四季豆(GB)的日ETc; 2)评估机器学习(ML)模型在估算日ETc和Tc方面的潜力。灌溉试验于2020-2021年和2021-2022年冬季在美国佛罗里达州佛罗里达大学热带研究与教育中心(TREC)进行。利用冠上红外热电偶(IRTs)和土壤湿度(SM)传感器网络采集土壤温度和土壤湿度。使用基于无人机(UAV)的RedEdge-MX传感器收集多光谱图像。汇总干期SM的亚小时变化,估算SC和GB的日测量ETc。CWSI的时间序列由Tc生成,而Kc则由无人机图像生成的11个植被指数(VIs)估算。此外,还评估了CatBoost (CB)、Random Forest (RF)、k-Nearest Neighbors (kNN)和Extreme Gradient Boosting (XGB)四种ML模型用于模拟等。CB、kNN、RF、XGB、Light Gradient Boosting Machine (LGB)和Deep Learning (DL)这6种模型也被用来模拟SC和GB的Tc。结果表明,CWSI方法在估计ETc时是可以接受的,SC的平均MAE为0.90 mm day-1, GB的平均MAE为0.62 mm day-1。在11个植被指数(VIs)中,有4个指数(SAVI)、归一化绿红差异指数(NGRDI)、红边归一化植被差异指数(RENDVI)和NIR-RE归一化植被差异指数(NIRRENDVI)在估算日ETc方面表现优异。ML模型对ETc和Tc的捕获精度更高。ETc在四个模型中的平均均方根误差(RMSE)为SC的0.86 mm day-1和GB的0.89 mm day-1。SC和GB模拟Tc的ML模型的平均RMSE分别为±1.1°C和±1.5°C。总的来说,CWSI、基于光谱反射率的Kc和ML模型被证明是在更精细的时空尺度上以合理的精度估计ETc的有用工具。
本文章由计算机程序翻译,如有差异,请以英文原文为准。
求助全文
约1分钟内获得全文
求助全文
来源期刊

CiteScore
8.00
自引率
8.50%
发文量
204
审稿时长
65 days
期刊介绍:
The journal ''Remote Sensing Applications: Society and Environment'' (RSASE) focuses on remote sensing studies that address specific topics with an emphasis on environmental and societal issues - regional / local studies with global significance. Subjects are encouraged to have an interdisciplinary approach and include, but are not limited by: " -Global and climate change studies addressing the impact of increasing concentrations of greenhouse gases, CO2 emission, carbon balance and carbon mitigation, energy system on social and environmental systems -Ecological and environmental issues including biodiversity, ecosystem dynamics, land degradation, atmospheric and water pollution, urban footprint, ecosystem management and natural hazards (e.g. earthquakes, typhoons, floods, landslides) -Natural resource studies including land-use in general, biomass estimation, forests, agricultural land, plantation, soils, coral reefs, wetland and water resources -Agriculture, food production systems and food security outcomes -Socio-economic issues including urban systems, urban growth, public health, epidemics, land-use transition and land use conflicts -Oceanography and coastal zone studies, including sea level rise projections, coastlines changes and the ocean-land interface -Regional challenges for remote sensing application techniques, monitoring and analysis, such as cloud screening and atmospheric correction for tropical regions -Interdisciplinary studies combining remote sensing, household survey data, field measurements and models to address environmental, societal and sustainability issues -Quantitative and qualitative analysis that documents the impact of using remote sensing studies in social, political, environmental or economic systems
 求助内容:
求助内容: 应助结果提醒方式:


