Mugdha Deshpande, Neha Kajale, Nikhil Shah, Ketan Gondhalekar, Vivek Patwardhan, Anagha Pai Raiturker, Sanjay Gupte, Leena Patankar, Anuradha Khadilkar
{"title":"Longitudinal insights into maternal body composition across trimesters of pregnancy.","authors":"Mugdha Deshpande, Neha Kajale, Nikhil Shah, Ketan Gondhalekar, Vivek Patwardhan, Anagha Pai Raiturker, Sanjay Gupte, Leena Patankar, Anuradha Khadilkar","doi":"10.1186/s40748-025-00223-w","DOIUrl":null,"url":null,"abstract":"<p><strong>Background and objectives: </strong>Maternal nutrition indicated by fat and fat-free mass gains is a sensitive determinant of infant growth; however, there is a dearth of literature on the impact of specific body composition indicators on infant growth, especially from India. Thus, we aimed to study trends in body composition of pregnant women according to pre-pregnancy body mass index (BMI) through gestation and at birth and to evaluate the effect of maternal body composition changes on infant morphometry at birth.</p><p><strong>Methods and material: </strong>We analyzed data on 268 pregnant women enrolled in a prospective observational longitudinal (MAI: Mother and Infant) cohort. Pregnant women and their infants were longitudinally measured for their anthropometry and women were measured for body composition and interviewed for socio-demography, diet, and physical activity once in each trimester during pregnancy. Pearson's correlation analysis and linear regression were performed to assess the relationship between maternal body composition and the infant's morphometry at birth. P-value < 0.05 was considered statistically significant.</p><p><strong>Results: </strong>Among women belonging to underweight, normal, and overweight/obese BMI category, gestational weight gain (GWG%) and post-partum weight loss (%) were 27.5 ± 9.2, 21.7 ± 7.8, 16.9 ± 7.5 and - 10.1 ± 4.4, -8.7 ± 3.4, -7.3 ± 2.5 respectively. Fat (%) increased during pregnancy and decreased at childbirth (Underweight: 24.6 ± 4.0 vs. 29.7 ± 4.0 and 26.7 ± 3.9, normal: 32.5 ± 3.8 vs. 37.0 ± 3.7 and 34.3 ± 4.2, overweight/obese: 42.0 ± 4.1 vs. 45.5 ± 4.0 and 44.3 ± 4.6). Sedentary (r = 0.405), and light activity (r = 0.334), and dietary fat intake(r = 0.231) were correlated with fat%(p < 0.05 for all). Fat gain among women in underweight (B: 0.05, 95%CI: 0.005-0.09) and normal BMI category (B:0.04, 95%CI: 0.008-0.07), but not overweight/obese BMI category (B = 0.04, 95% CI: -0.01-0.09) was a significant predictor of infant birth weight.</p><p><strong>Conclusion: </strong>Distinct BMI categories exhibited varying trends of change in fat percentage where women belonging to the underweight BMI category gained the highest fat% and lost most of it during childbirth as compared to those in the overweight/obese BMI category. An increase in fat among women in the underweight and normal but not overweight/obese BMI categories was associated with infant birth weight.</p>","PeriodicalId":74120,"journal":{"name":"Maternal health, neonatology and perinatology","volume":"11 1","pages":"22"},"PeriodicalIF":0.0000,"publicationDate":"2025-08-08","publicationTypes":"Journal Article","fieldsOfStudy":null,"isOpenAccess":false,"openAccessPdf":"https://www.ncbi.nlm.nih.gov/pmc/articles/PMC12333130/pdf/","citationCount":"0","resultStr":null,"platform":"Semanticscholar","paperid":null,"PeriodicalName":"Maternal health, neonatology and perinatology","FirstCategoryId":"1085","ListUrlMain":"https://doi.org/10.1186/s40748-025-00223-w","RegionNum":0,"RegionCategory":null,"ArticlePicture":[],"TitleCN":null,"AbstractTextCN":null,"PMCID":null,"EPubDate":"","PubModel":"","JCR":"","JCRName":"","Score":null,"Total":0}
引用次数: 0
Abstract
Background and objectives: Maternal nutrition indicated by fat and fat-free mass gains is a sensitive determinant of infant growth; however, there is a dearth of literature on the impact of specific body composition indicators on infant growth, especially from India. Thus, we aimed to study trends in body composition of pregnant women according to pre-pregnancy body mass index (BMI) through gestation and at birth and to evaluate the effect of maternal body composition changes on infant morphometry at birth.
Methods and material: We analyzed data on 268 pregnant women enrolled in a prospective observational longitudinal (MAI: Mother and Infant) cohort. Pregnant women and their infants were longitudinally measured for their anthropometry and women were measured for body composition and interviewed for socio-demography, diet, and physical activity once in each trimester during pregnancy. Pearson's correlation analysis and linear regression were performed to assess the relationship between maternal body composition and the infant's morphometry at birth. P-value < 0.05 was considered statistically significant.
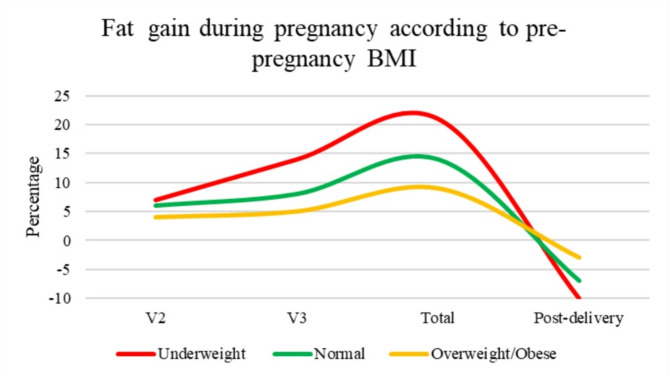
Results: Among women belonging to underweight, normal, and overweight/obese BMI category, gestational weight gain (GWG%) and post-partum weight loss (%) were 27.5 ± 9.2, 21.7 ± 7.8, 16.9 ± 7.5 and - 10.1 ± 4.4, -8.7 ± 3.4, -7.3 ± 2.5 respectively. Fat (%) increased during pregnancy and decreased at childbirth (Underweight: 24.6 ± 4.0 vs. 29.7 ± 4.0 and 26.7 ± 3.9, normal: 32.5 ± 3.8 vs. 37.0 ± 3.7 and 34.3 ± 4.2, overweight/obese: 42.0 ± 4.1 vs. 45.5 ± 4.0 and 44.3 ± 4.6). Sedentary (r = 0.405), and light activity (r = 0.334), and dietary fat intake(r = 0.231) were correlated with fat%(p < 0.05 for all). Fat gain among women in underweight (B: 0.05, 95%CI: 0.005-0.09) and normal BMI category (B:0.04, 95%CI: 0.008-0.07), but not overweight/obese BMI category (B = 0.04, 95% CI: -0.01-0.09) was a significant predictor of infant birth weight.
Conclusion: Distinct BMI categories exhibited varying trends of change in fat percentage where women belonging to the underweight BMI category gained the highest fat% and lost most of it during childbirth as compared to those in the overweight/obese BMI category. An increase in fat among women in the underweight and normal but not overweight/obese BMI categories was associated with infant birth weight.

 求助内容:
求助内容: 应助结果提醒方式:


