{"title":"High-frequency content within the QRS complex can predict ventricular tachyarrhythmias in hypertrophic cardiomyopathy","authors":"Takeshi Tsutsumi MD, PhD, Jun Yokomachi MD, Takafumi Nakajima MD, Kentaro Minami MD, PhD, Nami Takano MD, PhD, Kuniaki Iwasawa MD, PhD, Gaku Oguri MD, PhD, Shigeru Toyoda MD, PhD, Toshiaki Nakajima MD, PhD","doi":"10.1002/joa3.70130","DOIUrl":null,"url":null,"abstract":"<div>\n \n \n <section>\n \n <h3> Introduction</h3>\n \n <p>Frequency analysis of the electrocardiographic QRS complex (QRS) was performed to evaluate the abnormal ventricular excitation in hypertrophic cardiomyopathy (HCM), from which we validated a risk stratification for lethal ventricular arrhythmias (L-VAs).</p>\n </section>\n \n <section>\n \n <h3> Methods</h3>\n \n <p>We selected 32 patients with HCM and 60 control subjects from a population of 520 consecutive patients with syncopal seizures in a university hospital. We measured bipolar X, Y, and Z leads and calculated the frequency power using continuous wavelet transform (CWT). We compared frequency powers, ranging from 15 to 250 Hz, between patients with HCM with and without L-VAs. ROC curve analysis was applied to evaluate the differences between groups.</p>\n </section>\n \n <section>\n \n <h3> Results</h3>\n \n <p>The frequency powers of the QRS were increased in HCM in the wide frequency ranges, except for 49–62 Hz. The sum of the frequency power from 150 to 250 Hz was significantly higher in HCM with versus without L-VAs. The area under the ROC curve was 0.83. The occurrence of L-VAs could be predicted with a sensitivity of 0.92 and a specificity of 0.56.</p>\n </section>\n \n <section>\n \n <h3> Conclusion</h3>\n \n <p>The high-frequency power hidden in the QRS may be a valuable predictor of L-VAs in patients with HCM.</p>\n </section>\n </div>","PeriodicalId":15174,"journal":{"name":"Journal of Arrhythmia","volume":"41 4","pages":""},"PeriodicalIF":1.7000,"publicationDate":"2025-07-28","publicationTypes":"Journal Article","fieldsOfStudy":null,"isOpenAccess":false,"openAccessPdf":"https://onlinelibrary.wiley.com/doi/epdf/10.1002/joa3.70130","citationCount":"0","resultStr":null,"platform":"Semanticscholar","paperid":null,"PeriodicalName":"Journal of Arrhythmia","FirstCategoryId":"1085","ListUrlMain":"https://onlinelibrary.wiley.com/doi/10.1002/joa3.70130","RegionNum":0,"RegionCategory":null,"ArticlePicture":[],"TitleCN":null,"AbstractTextCN":null,"PMCID":null,"EPubDate":"","PubModel":"","JCR":"Q2","JCRName":"CARDIAC & CARDIOVASCULAR SYSTEMS","Score":null,"Total":0}
引用次数: 0
Abstract
Introduction
Frequency analysis of the electrocardiographic QRS complex (QRS) was performed to evaluate the abnormal ventricular excitation in hypertrophic cardiomyopathy (HCM), from which we validated a risk stratification for lethal ventricular arrhythmias (L-VAs).
Methods
We selected 32 patients with HCM and 60 control subjects from a population of 520 consecutive patients with syncopal seizures in a university hospital. We measured bipolar X, Y, and Z leads and calculated the frequency power using continuous wavelet transform (CWT). We compared frequency powers, ranging from 15 to 250 Hz, between patients with HCM with and without L-VAs. ROC curve analysis was applied to evaluate the differences between groups.
Results
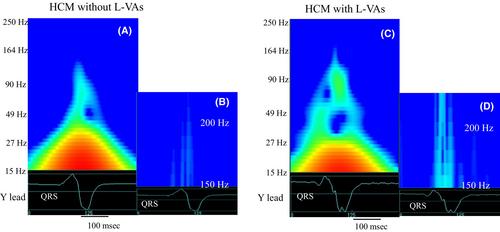
The frequency powers of the QRS were increased in HCM in the wide frequency ranges, except for 49–62 Hz. The sum of the frequency power from 150 to 250 Hz was significantly higher in HCM with versus without L-VAs. The area under the ROC curve was 0.83. The occurrence of L-VAs could be predicted with a sensitivity of 0.92 and a specificity of 0.56.
Conclusion
The high-frequency power hidden in the QRS may be a valuable predictor of L-VAs in patients with HCM.

 求助内容:
求助内容: 应助结果提醒方式:


