Yuanjun Teng, Jian Yu, Kangrui Zhang, Lijun Da, Sixian Li, Jianming Zhou, Wenming Chen, Xu Wang, Xin Ma
{"title":"Measurements of Posterior Tibial Slope of the Ankle Joint on CT Images and Virtual Radiographs.","authors":"Yuanjun Teng, Jian Yu, Kangrui Zhang, Lijun Da, Sixian Li, Jianming Zhou, Wenming Chen, Xu Wang, Xin Ma","doi":"10.1111/os.70111","DOIUrl":null,"url":null,"abstract":"<p><strong>Objective: </strong>The posterior tibial slope (PTS) is essential in the assessment of ankle alignment. However, its standardized reference value has not been adequately investigated. This study aims to compare the PTS of the ankle joint on virtual radiographs and CT images and determine the effect of participants' demographic characteristics on the PTS.</p><p><strong>Methods: </strong>A retrospective analysis was conducted in healthy populations who underwent CT scans of the ankle joint. A total of 106 participants (53 males and 53 females) were included in our study. The three-dimensional model of the ankle joint was reconstructed by CT images, and the standard coronal and sagittal planes were produced using the anatomical coordinate system. The PTS was measured on different CT sagittal planes and virtual radiographs. All measurements were performed using three reference axes, including the anterior cortex axis, the anatomical axis, and the posterior cortex axis of the tibial shaft. Subgroup and correlation analyses were performed to investigate the effect of participants' demographic characteristics (the age, height, gender, and BMI) on the PTS. Statistical comparisons between two groups were performed using independent t-tests, while variations across sagittal planes and reference axes were analyzed through one-way analysis of variance.</p><p><strong>Results: </strong>The mean values of PTS varied from 76.7° to 83.4° on different sagittal planes of CT images, and there was an increasing trend for PTS from the medial to lateral CT images. The mean values of PTS on the virtual radiograph were 81.6°, 82.3°, and 80.8° for the anterior cortex, anatomical, and posterior cortex axes, respectively. Significant differences in PTS measurements were found between CT images and virtual radiographs (p < 0.05). However, no differences were found while using different reference axes on PTS measurements (p < 0.05). Subgroup analysis showed females had a greater PTS than males, indicating a gender-based difference in the anatomy of the PTS.</p><p><strong>Conclusion: </strong>The PTS varied on CT images and radiographs, and the anterior cortex, anatomical, and posterior cortex axes do not significantly influence the PTS measurements. The observed gender-based differences highlight the need for individualized surgical planning and the development of sex-specific implants.</p>","PeriodicalId":19566,"journal":{"name":"Orthopaedic Surgery","volume":" ","pages":"2680-2688"},"PeriodicalIF":2.1000,"publicationDate":"2025-09-01","publicationTypes":"Journal Article","fieldsOfStudy":null,"isOpenAccess":false,"openAccessPdf":"https://www.ncbi.nlm.nih.gov/pmc/articles/PMC12404855/pdf/","citationCount":"0","resultStr":null,"platform":"Semanticscholar","paperid":null,"PeriodicalName":"Orthopaedic Surgery","FirstCategoryId":"3","ListUrlMain":"https://doi.org/10.1111/os.70111","RegionNum":2,"RegionCategory":"医学","ArticlePicture":[],"TitleCN":null,"AbstractTextCN":null,"PMCID":null,"EPubDate":"2025/7/24 0:00:00","PubModel":"Epub","JCR":"Q2","JCRName":"ORTHOPEDICS","Score":null,"Total":0}
引用次数: 0
Abstract
Objective: The posterior tibial slope (PTS) is essential in the assessment of ankle alignment. However, its standardized reference value has not been adequately investigated. This study aims to compare the PTS of the ankle joint on virtual radiographs and CT images and determine the effect of participants' demographic characteristics on the PTS.
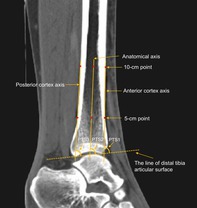
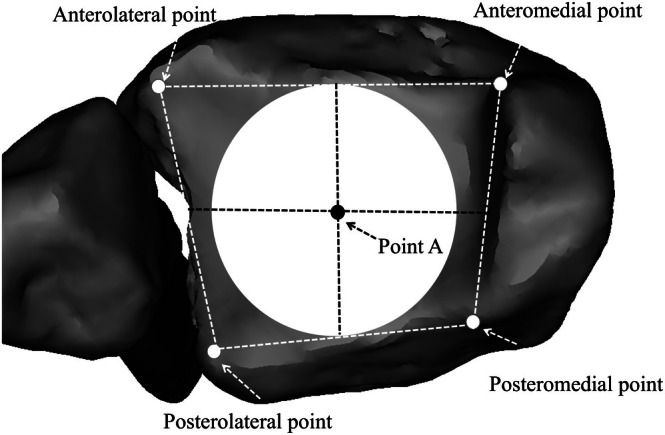
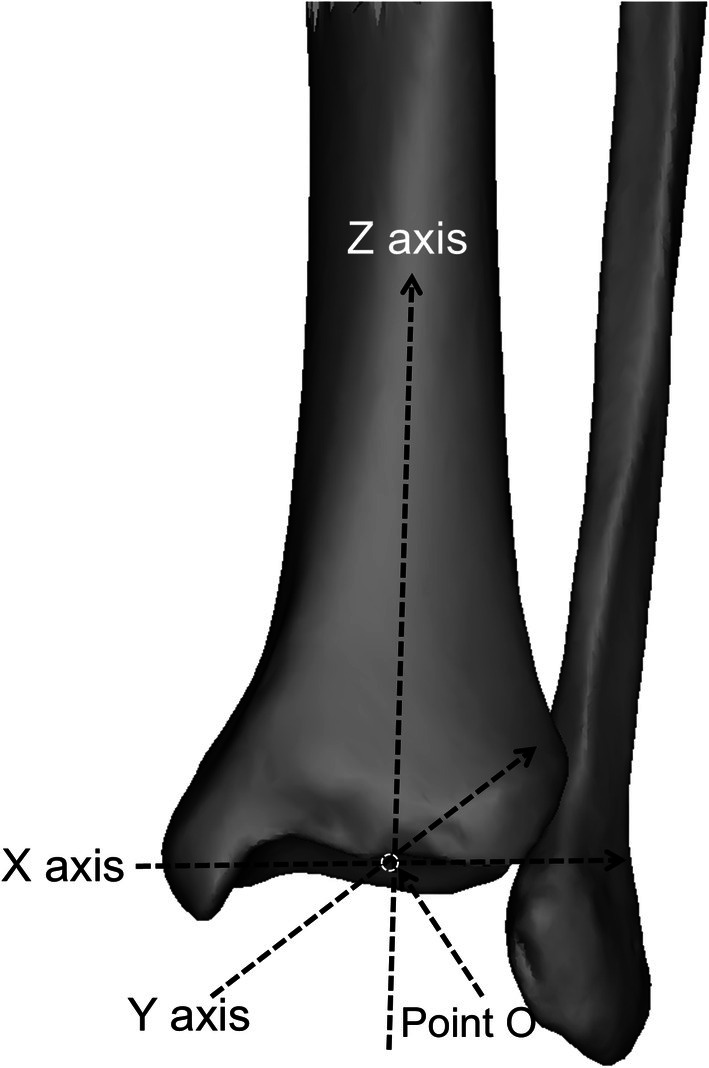
Methods: A retrospective analysis was conducted in healthy populations who underwent CT scans of the ankle joint. A total of 106 participants (53 males and 53 females) were included in our study. The three-dimensional model of the ankle joint was reconstructed by CT images, and the standard coronal and sagittal planes were produced using the anatomical coordinate system. The PTS was measured on different CT sagittal planes and virtual radiographs. All measurements were performed using three reference axes, including the anterior cortex axis, the anatomical axis, and the posterior cortex axis of the tibial shaft. Subgroup and correlation analyses were performed to investigate the effect of participants' demographic characteristics (the age, height, gender, and BMI) on the PTS. Statistical comparisons between two groups were performed using independent t-tests, while variations across sagittal planes and reference axes were analyzed through one-way analysis of variance.
Results: The mean values of PTS varied from 76.7° to 83.4° on different sagittal planes of CT images, and there was an increasing trend for PTS from the medial to lateral CT images. The mean values of PTS on the virtual radiograph were 81.6°, 82.3°, and 80.8° for the anterior cortex, anatomical, and posterior cortex axes, respectively. Significant differences in PTS measurements were found between CT images and virtual radiographs (p < 0.05). However, no differences were found while using different reference axes on PTS measurements (p < 0.05). Subgroup analysis showed females had a greater PTS than males, indicating a gender-based difference in the anatomy of the PTS.
Conclusion: The PTS varied on CT images and radiographs, and the anterior cortex, anatomical, and posterior cortex axes do not significantly influence the PTS measurements. The observed gender-based differences highlight the need for individualized surgical planning and the development of sex-specific implants.
期刊介绍:
Orthopaedic Surgery (OS) is the official journal of the Chinese Orthopaedic Association, focusing on all aspects of orthopaedic technique and surgery.
The journal publishes peer-reviewed articles in the following categories: Original Articles, Clinical Articles, Review Articles, Guidelines, Editorials, Commentaries, Surgical Techniques, Case Reports and Meeting Reports.
 求助内容:
求助内容: 应助结果提醒方式:


