{"title":"Uncertainty-Aware Visualization of Biomolecular Structures","authors":"A. Sterzik, C. Gillmann, M. Krone, K. Lawonn","doi":"10.1111/cgf.70155","DOIUrl":null,"url":null,"abstract":"<p>Molecular structure visualization is fundamental to molecular biology, aiding in understanding complex biological processes. While advancements in molecular visualization have greatly improved the representation of these structures, inherent uncertainties—such as inaccuracies in atomic positions or variability in secondary structure classifications—impact the accuracy of the visualizations. Uncertainty-aware visualization (UAV) emerged as a response to these challenges, integrating uncertainty into visual representations to improve data interpretation and decision-making. Despite extensive work on both molecular and uncertainty visualization (UV), there is a lack of comprehensive surveys addressing the intersection of these two fields. This paper provides a state-of-the-art review of UAV approaches for biomolecular structures. We propose a classification schema that organizes existing methods based on the type of molecule visualized, the manifestation of uncertainty, and the mapping of uncertainty to a visual representation. Using this framework, we identified research gaps and areas for future exploration in uncertainty-aware biomolecular structure visualization.</p><p>The visualization of molecular structures has long been an integral part of structural molecular biology and continues to develop as a critical tool in scientific and industrial research. Since the early days of the field, molecular visualization has enabled researchers to gain an intuitive understanding of complex molecular systems that would otherwise be inaccessible through raw numerical data alone. Structural representations provide insight into the form and function of molecules, which are inherently linked. A well-known example is the lock-and-key metaphor for molecular docking, which, while simplified, illustrates the importance of molecular shape in determining biological interactions. By transforming abstract data into interpretable visual models, visualization allows scientists to identify relationships, mechanisms, and patterns essential for advancing molecular biology, drug design, and bioinformatics.</p><p>Levinthal [<span>Lev66</span>] was the first to use known positions of atoms, obtained by early X-Ray diffraction studies [<span>Ken61</span>, <span>Per64</span>], to interactively visualize 3D structural images of small proteins. Over the years, molecular visualization has advanced significantly. The field has seen the development of diverse visualization and visual analysis techniques, driven by growing computational capabilities and the increasing complexity of biological data. This progress is reflected in comprehensive surveys such as the one by Kozlíková et al. [<span>KKF*17</span>], which provides a detailed overview of the state-of-the-art in molecular structure visualization.</p><p>One of the inherent challenges with visualization is the potential introduction of uncertainty at any stage of the visualization pipeline, from data acquisition to the final visualization and its interpretation by the viewer [<span>BAOL12</span>]. There are many potential sources of uncertainty. For instance, the obtained positions of atoms can be inaccurate due to uncertainty in the data acquisition process. Another important example is the variability in molecular conformations, as represented by ensembles. Ensembles obtained from techniques such as nuclear magnetic resonance (NMR) spectroscopy illustrate a range of possible structures rather than a single, static conformation. Similarly, derived properties like the root mean square fluctuation (RMSF), which depends on atom positions during a dynamics simulation, can also be susceptible to uncertainties. Other forms of uncertainty come from computational methods such as assignments of secondary structure elements: Different classifiers that assign structural elements to parts of the amino acid sequence yield different results. Understanding these uncertainties is essential as they are directly impacting the reliability and interpretation of molecular visualizations. Coming back to the earlier example of molecular docking, uncertainties in atomic positions can severely affect the docking process. In such cases, it is not only the most probable structure that matters but also other plausible conformations, as they may influence the outcome and provide a more comprehensive understanding of molecular interactions.</p><p>To address these issues and communicate associated uncertainties, the field of UAV has emerged. It focuses on integrating data and its uncertainty into a unified computation and visualization pipeline, ultimately helping users make more informed decisions. This is particularly important because visualization tends to suggest a level of accuracy rarely present in the data [<span>JS03</span>]. However, incorporating uncertainty information into a visualization presents its own challenges. It tends to increase the visual complexity, potentially hindering the perception of the core data [<span>BHJ*14</span>]. In the context of biomolecular structures, UV has been an active area of research for over 30 years, with some of the earliest examples shown in Figure 2. Despite this, existing surveys focus on either specific aspects of molecular visualization or UV in general, with no survey addressing the unique intersection of these two topics.</p><p>Thus, this report provides an overview of existing UAV approaches for biomolecular structures. While this is particularly relevant to the study of biomolecules, it also holds mutual benefits for the broader visualization community. Molecular structure data is versatile, complex, and derived from a variety of sources. The techniques developed for visualizing uncertainty can enhance molecular visualization and provide valuable insights for other fields that handle complex and uncertain data. Additionally, innovations in these fields could inspire new methods and improvements in the visualization of uncertainty for biomolecular structures.</p><p>To structure and provide an overview of works on UAV of biomolecular structures, we introduce a classification schema (Figure 1) that categorizes approaches by molecule type, uncertainty manifestation, and uncertainty mapping. This classification allows for a better understanding of the diverse techniques and helps identify trends and gaps in current methodologies. For example, there is a significant lack of UAV techniques for large-scale data, despite the rapid growth of structural datasets. By identifying such gaps, we highlight promising opportunities for advancing the field.</p><p>Our survey's main contributions can be summarized as follows:</p><p>This report is organized as follows: First, we discuss related surveys (Section 2). Next, we introduce the necessary background on molecular structure visualization (Section 3), and UAV (Section 4). Then, we discuss the scope of this paper in more detail and present our proposed taxonomy for uncertainty-aware visualization approaches for biomolecular structures (Section 5). Section 6, Section 7, and Section 8 then describes the approaches for small molecules, proteins, and nucleic acids, respectively. Afterward, we discuss the existing approaches (Section 9) and future research directions (Section 10) before we conclude this report in Section 11.</p><p>While surveys on UV and biomolecular visualization individually are manifold, a comprehensive survey of the intersection of both areas is still missing in the literature. Surveys on biological or biomolecular visualization frequently acknowledge uncertainty but typically address it in a limited scope, often focusing solely on individual aspects. Kozlíková et al. [<span>KKF*17</span>] provide a broad overview of state-of-the-art techniques in biomolecular structure visualization. Their report includes a section on molecular dynamics visualization, covering methods for illustrating biomolecular flexibility and volumetric representations.</p><p>Krone et al. [<span>KKL*16</span>] review techniques for visualizing biomolecular cavities, also discussing several sources of uncertainty inherent to this field. They highlight the challenges of visualizing dynamic cavities, which fluctuate over time as molecular structures are inherently dynamic. Additionally, the authors emphasize the need for visualization tools that can compare and evaluate different cavity detection methods, noting significant discrepancies—up to 200%—in volume measurements across tools. Despite these challenges, only a few tools can currently calculate uncertainties in their measurements. The increasing size and complexity of data drive the need for multiscale visualization approaches. The 2019 survey by Miao et al. [<span>MKK*19</span>] explores these multiscale molecular visualization methods and emphasizes the importance of overview visualizations. For this purpose, highly abstracted and/or aggregated UV techniques are featured in their review. The recent review of biomolecular visualization by Li and Wei [<span>LW24</span>] includes a brief section on positional UV, outlining common encodings and some newer techniques.</p><p>Since molecular dynamics (MD) simulation computes the dynamic properties of molecules, this topic is closely related to molecular flexibility and positional uncertainty. Belghit et al. [<span>BSD*24</span>] reviewed the visualization of MD trajectories, while Corey et al. [<span>CBC23</span>] specifically reviewed the visualization of MD simulations for membrane systems.</p><p>In 1997, Pang et al. [<span>PWL97</span>] developed a classification scheme for early UV approaches. It incorporates properties of the data and visualization themselves, such as its dimensionality and discrete or continuous nature. Additionally, they categorize approaches according to how they add uncertainty information to the visualizations. They identified the methods: glyphs, adding/modifying geometry, modifying attributes, animation, sonification, and psycho-visual. Brodlie et al. [<span>BAOL12</span>] discussed reasons for UV being a difficult problem. One major reason is the complexity of uncertainty itself, with even the terminology of uncertainty often being unclear. For biomolecular UV, for example, uncertainty is often used interchangeably with error, precision, or flexibility. Another difficulty is that uncertainty adds another dimension to a visualization. For one- or two-dimensional data, this makes the visualization more complex but is relatively easily solvable. Most biomolecular structure visualizations are inherently three-dimensional. Thus, adding another dimension—the uncertainty—becomes more challenging. Additionally, they specifically emphasize the distinction of <i>visualization of uncertainty</i> and <i>uncertainty of visualization</i>: Research usually considers the visualization of uncertainty in a dataset. However, the visualization itself—through filtering, mapping, and rendering—adds another layer of uncertainty. Bonneau et al. [<span>BHJ*14</span>] formally describe uncertainty and discuss UV in several fields like medical visualization or weather and climate.</p><p>Ensemble visualization is closely related to the visualization of uncertainty. In fact, a common metaphor for indicating uncertainty in biomolecular structures is ensemble visualization. The ensemble visualization survey by Wang et al. [<span>WHLS19</span>] does not explicitly address biomolecular structures; however, several techniques for visualizing ensembles of surfaces or volumes are either currently applied to biomolecular structures or are adaptable for this purpose.</p><p>Padilla et al. [<span>PKH21</span>] recently outlined best practices for UV, discussing cognitive theories that explain how these methods affect viewers' judgments. They primarily examined lower-dimensional (1D, 2D) UV, including error bars, icon arrays, and 2D ensemble plots. In their 2006 survey on UV, Griethe and Schumann [<span>GS06</span>] highlighted the scarcity of usability studies as a key gap in the field. Over a decade later, Hullman et al. [<span>HQC*19</span>] conducted an in-depth survey on evaluating UV, identifying several unresolved issues. Notably, they observed a prevalent research bias toward assessing performance accuracy over decision quality. They proposed guidelines for adopting transparent and valid evaluation methods.</p><p>Weiskopf [<span>Wei22</span>] discusses UV and illustrates general concepts with examples of biological data visualization. However, his paper is not a systematic survey and because it focuses on biological data in general, only a few molecular <i>structure</i> visualizations are featured. Therefore, a comprehensive overview of uncertainty in biomolecular structure visualization is still missing in the literature.</p><p>In this section, we provide a brief overview of molecular structure visualization. We begin with a summary of biomolecules (Section 3.1), followed by the description of various methods for acquiring biomolecular structure data (Section 3.2). Finally, we discuss molecular representation models (Section 3.3). We provide only brief overviews of these topics; for more in-depth information on biomolecules and biomolecular data acquisition, please see Nelson and Cox [<span>NC21</span>], Berg et al. [<span>BTS10</span>], and Alberts et al. [<span>AHJ*22</span>]. Further information on representation models and visualization can be found in the report by Kozlíková et al. [<span>KKF*17</span>].</p><p>Uncertainty visualization (UV) focuses on explicitly representing errors or uncertainty in the data. Uncertainty-aware visualization (UAV) builds on this by integrating the visualization of uncertainty directly with the data itself, ensuring both are effectively represented [<span>GSWS21</span>]. Here, we focus on the latter approach, where the data and its uncertainty are visualized together. However, such visualizations are often still referred to as UV. In this section, we outline potential sources of uncertainty (Section 4.1), discuss how these map to biomolecular data (Section 4.2), introduce common mapping strategies for visualizing uncertainties (Section 4.3), and discuss specifics of uncertainty visualization for biomolecular data and commonalities with other domains (Section 4.4).</p><p>Next, we specify our scope and selection process (Section 5.1) and detail our classification schema (Section 5.2).</p><p>While the methods discussed in this section are illustrated with small molecules, they are not inherently restricted to them. Certain techniques, particularly those that rely on ball-and-stick representations, may not be optimal for larger molecules, though theoretically, they could still be used. On the other hand, methods employing volume visualization should be more readily applicable to various types of biomolecules.</p><p><b>Explicit</b> In 1999, Rheingans and Joshi were the first to write a publication explicitly about molecular UV [<span>RJ99</span>]. They proposed three options for visualizing molecules with positional uncertainty (Figure 2). Two methods are based on a likelihood volume computed from the ensemble. The likelihood volume stores the probability of an atom being at each voxel. They gave two options for visualizing this volume. The first volume visualization extracts transparent isosurfaces from the volume and renders them on top of the opaque ball-and-stick visualization (Figure 2b). The other volume visualization method renders the volume directly, resulting in a cloud-like appearance (Figure 2c). The third method superposes each conformer in the ensemble using its ball-and-stick representation. Each conformation can either be rendered opaquely, or semi-transparently (Figure 2a) so that more certain regions appear opaque while uncertain regions appear more transparent.</p><p>Schmidt-Ehrenberg et al. [<span>SBH02</span>] used direct volume rendering (DVR) or opaque isosurfaces to display likelihood volumes. They focused on metastable conformations, which are states in which the molecule stays for a long time. Therefore, they visualized several metastable conformations of a molecule at once, while also displaying the likelihood volume for each of the metastable conformations separately.</p><p><b>Implicit</b> Best and Hege [<span>BH02</span>] let users cluster groups of atoms into ellipsoids in their application to reduce clutter and thus ease the detection of conformational changes. Additionally, they blended several time frames of a molecular simulation to facilitate detecting large changes. Similar to the implicit mapping proposed by Rheingans and Joshi [<span>RJ99</span>], Sabando et al. [<span>SUS*21</span>] visualized chemical compound similarity by layering semi-transparent visualizations of individual conformations. They added an option to invert the opacity. As a result, more uncertain parts of the molecule can be highlighted by appearing more opaque.</p><p><b>Ranges</b> Knoll et al. [<span>KCL*13</span>] defined the interval between the chemical bond radii and the vdW radii as an uncertainty interval over a charge density distribution. They rendered the molecules in black using the ball-and-stick representation. Then, they overlaid a visualization of an electron density volume. They used DVR with a custom transfer function. In most of their examples, they used two peaks for displaying the isolevel of chemical bonds in blue and the isolevel corresponding to the vdW radii in red. In their paper, they focused on molecular interfaces rather than biomolecules. Due to using the ball-and-stick representation, their visualization is suited to small molecules rather than larger biomolecules.</p><p><b>Size</b> Wagner and Himmel [<span>WH17</span>] used color and size to encode the RMSD between two molecular structures in a modified ball-and-stick representation. The sphere color indicates the atom pair's absolute RMSD. The sphere size is proportional to the relative contribution of the atom pair to the total RMSD.</p><p>The methods developed for small molecules generally provide overview visualizations of uncertainty. They indicate the presence of uncertainty in the molecule and give a rough sense of its magnitude. However, apart from the combined color and size coding by Wagner and Himmel [<span>WH17</span>], making more detailed judgments is likely challenging. These methods also do not facilitate compare or integrate tasks.</p><p>Proteins are the most extensively studied biomolecules for UV, with visualizations available for all types of uncertainty manifestations and mappings according to our schema. Similar to small molecules, many methods for UV apply to other biomolecule types. Nonetheless, certain techniques are specific to proteins, such as the visualization of secondary structures or cavities.</p><p>Most papers about nucleic acids focus on visualizing RNA. Only two papers specifically visualized DNA.</p><p>In the following, we will discuss patterns and trends of UV techniques for biomolecular structures. Figure 12 shows a parallel sets plot [<span>KBH06</span>] of the distribution and correlation of the collected literature's attributes along our schemas main dimensions. In the visualization, the dimensions—molecule type, manifestation, and mapping—are represented with consistent total contributions across layers. However, papers often vary in the number of applicable categories per dimension. We distribute each paper's contribution equally among the applicable categories within a given dimension. For example, if a paper employs three mapping strategies, each mapping receives a proportional width of 1/3 of the paper's total contribution. Conversely, a paper with only one mapping allocates its full contribution to that mapping. This strategy ensures that each paper contributes equally to the total width per dimension.</p><p>In the previous chapter, we explored trends and outlined various challenges in the field. Here, we narrow our focus and highlight a few areas we consider the most important for future research.</p><p><b>Complex and Multiscale Systems</b> Advances in imaging technologies enable the visualization of increasingly complex systems. While some approaches exist for visualizing systems of interacting molecules, such as protein-ligand interactions, there is significant room for improvement. UAV for even larger systems, such as mesoscale structures or visualizations spanning multiple scales, remain largely unexplored. Methods that work well for small to medium-sized molecular structures often become cluttered or impractical when applied to more complex systems. This highlights the need for approaches that can effectively manage the scale and complexity of these data. A potential solution is adopting more abstract and illustrative visualization techniques. These approaches could offer clearer, more interpretable visualizations while addressing the unique challenges of complex molecular systems.</p><p><b>Conformational Space</b> While there is already a substantial amount of literature visualizing the conformational space, the problem remains challenging, particularly for larger molecules, as existing techniques often become cluttered and difficult to interpret. Initial efforts to enhance these visualizations were undertaken by Melvin et al. [<span>MS16</span>], who employed focus and context, as well as a deliberately selected subset of conformations, to reduce visual complexity. Nevertheless, easily comprehensible visualizations of the entire conformational space remain scarce. Similar to the visualization of complex systems, the volume and complexity of the data can be overwhelming. However, the multidimensional nature of conformational spaces introduces additional challenges. As with complex systems, abstraction and illustrative techniques offer promising solutions. Simplified representations that emphasize key states or transitions could enhance clarity, while interactive tools for exploring specific regions of the conformational landscape could improve usability. Alternatively, animations—similar to HOPs [<span>Hul16</span>]—could dynamically represent conformational changes, reducing the need to convey all information within a single, static visualization.</p><p><b>Comparison Techniques</b> Comparing molecular configurations and their uncertainties typically involves side-by-side visualizations or simple overlays. These methods are effective for small datasets but become impractical as the number of molecules increases. Overlays face challenges similar to visualizing conformational space, such as becoming cluttered and difficult to interpret. This issue is especially problematic when comparing dynamic molecules. Ensembles of molecular dynamics (MD) simulations have become crucial for addressing the lack of reproducibility in individual simulations [<span>WSC21</span>]. However, MD ensembles generate vast amounts of data, requiring new visualization techniques capable of handling this complexity without overwhelming users. This challenge was also highlighted by Belghit et al. [<span>BSD*24</span>]. This scalability problem is not limited to biomolecular systems; it also affects broader ensemble visualization methods [<span>WHLS19</span>]. Advancements in both fields could offer mutual benefits, leading to better solutions for visualizing large, complex datasets.</p><p><b>Nucleic Acids</b> Despite being the focus of numerous current research topics [<span>WEFC21</span>,<span>BJZ*22</span>, <span>WD23</span>], nucleic acids are often underrepresented in terms of specialized UV techniques. Current visualizations primarily focus on base pair probabilities and rely on relatively simple methods. While these approaches provide some insight into nucleic acid structure, they are limited in scope and fail to capture the full complexity of these molecules. Comprehensive 3D visualizations, which could provide a more complete representation of nucleic acid structures, are largely absent. Additionally, visualizing the conformational space of nucleic acids remains a significant gap despite its importance for understanding molecular dynamics, interactions, and function.</p><p><b>Evaluation</b> UV techniques for biomolecular structures are not being evaluated rigorously enough. For example, it is crucial to determine which methods are most intuitive for viewers, how effectively they support the inference of quantitative values, and whether they accurately represent the conformational space of biomolecules. Since humans often reason in non-intuitive ways when interpreting uncertainty [<span>PKH21</span>], it is essential to rigorously evaluate uncertainty visualizations to ensure they effectively support accurate understanding and decision-making. Evaluating UV methods is inherently challenging [<span>Hul16</span>], even for simple 1D and 2D visualizations. Incorporating and evaluating uncertainty in the context of 3D biomolecular structure visualizations is even more complex. However, addressing this gap is essential. It will enable practitioners to choose the most suitable methods for specific problems, identify shortcomings in existing techniques, and drive the development of new methods that better meet the demands of UAV.</p><p>In this report, we presented UAV approaches for biomolecular structures, classifying the methods along three primary dimensions: molecule type, manifestation of uncertainty, and mapping strategy. While these methods demonstrate strategies for representing uncertainty for individual molecules, they often fall short of addressing the demands of modern biomolecular research. The constantly increasing size and complexity of biomolecular datasets require visualization techniques that scale effectively and remain interpretable. Current approaches frequently appear cluttered even for small to medium-sized molecules, making them unsuitable for larger systems such as mesoscale data or ensembles of dynamic structures. These gaps highlight the need for innovative visualization strategies that can handle the complexity and scale of modern biomolecular data. Advancing UAV methods is essential for improving how researchers interpret and interact with complex biomolecular data, enabling clearer insights and more informed decision-making. Given the parallels to other domains, such as general uncertainty and ensemble visualization, advancements in UAV for biomolecular structures are likely to have a broader impact, benefiting the entire field of UAV.</p><p>We want to thank Frank Cordes, Ute Hellmich, Philipp Schnee, Philipp Thiel, Markus Weber, and Christoph Wiedemann for the insightful discussions on UV for biomolecular structures. We would also like to thank Katarína Furmanová, Barbora Kozlíková, and Robin Skånberg for sharing images with us for this report. This work was partially funded by the Deutsche Forschungsgemeinschaft (DFG, German Research Foundation) — Project-ID 437702916. Open Access funding enabled and organized by Projekt DEAL.</p>","PeriodicalId":10687,"journal":{"name":"Computer Graphics Forum","volume":"44 3","pages":""},"PeriodicalIF":2.9000,"publicationDate":"2025-05-27","publicationTypes":"Journal Article","fieldsOfStudy":null,"isOpenAccess":false,"openAccessPdf":"https://onlinelibrary.wiley.com/doi/epdf/10.1111/cgf.70155","citationCount":"0","resultStr":null,"platform":"Semanticscholar","paperid":null,"PeriodicalName":"Computer Graphics Forum","FirstCategoryId":"94","ListUrlMain":"https://onlinelibrary.wiley.com/doi/10.1111/cgf.70155","RegionNum":4,"RegionCategory":"计算机科学","ArticlePicture":[],"TitleCN":null,"AbstractTextCN":null,"PMCID":null,"EPubDate":"","PubModel":"","JCR":"Q2","JCRName":"COMPUTER SCIENCE, SOFTWARE ENGINEERING","Score":null,"Total":0}
引用次数: 0
Abstract
Molecular structure visualization is fundamental to molecular biology, aiding in understanding complex biological processes. While advancements in molecular visualization have greatly improved the representation of these structures, inherent uncertainties—such as inaccuracies in atomic positions or variability in secondary structure classifications—impact the accuracy of the visualizations. Uncertainty-aware visualization (UAV) emerged as a response to these challenges, integrating uncertainty into visual representations to improve data interpretation and decision-making. Despite extensive work on both molecular and uncertainty visualization (UV), there is a lack of comprehensive surveys addressing the intersection of these two fields. This paper provides a state-of-the-art review of UAV approaches for biomolecular structures. We propose a classification schema that organizes existing methods based on the type of molecule visualized, the manifestation of uncertainty, and the mapping of uncertainty to a visual representation. Using this framework, we identified research gaps and areas for future exploration in uncertainty-aware biomolecular structure visualization.
The visualization of molecular structures has long been an integral part of structural molecular biology and continues to develop as a critical tool in scientific and industrial research. Since the early days of the field, molecular visualization has enabled researchers to gain an intuitive understanding of complex molecular systems that would otherwise be inaccessible through raw numerical data alone. Structural representations provide insight into the form and function of molecules, which are inherently linked. A well-known example is the lock-and-key metaphor for molecular docking, which, while simplified, illustrates the importance of molecular shape in determining biological interactions. By transforming abstract data into interpretable visual models, visualization allows scientists to identify relationships, mechanisms, and patterns essential for advancing molecular biology, drug design, and bioinformatics.
Levinthal [Lev66] was the first to use known positions of atoms, obtained by early X-Ray diffraction studies [Ken61, Per64], to interactively visualize 3D structural images of small proteins. Over the years, molecular visualization has advanced significantly. The field has seen the development of diverse visualization and visual analysis techniques, driven by growing computational capabilities and the increasing complexity of biological data. This progress is reflected in comprehensive surveys such as the one by Kozlíková et al. [KKF*17], which provides a detailed overview of the state-of-the-art in molecular structure visualization.
One of the inherent challenges with visualization is the potential introduction of uncertainty at any stage of the visualization pipeline, from data acquisition to the final visualization and its interpretation by the viewer [BAOL12]. There are many potential sources of uncertainty. For instance, the obtained positions of atoms can be inaccurate due to uncertainty in the data acquisition process. Another important example is the variability in molecular conformations, as represented by ensembles. Ensembles obtained from techniques such as nuclear magnetic resonance (NMR) spectroscopy illustrate a range of possible structures rather than a single, static conformation. Similarly, derived properties like the root mean square fluctuation (RMSF), which depends on atom positions during a dynamics simulation, can also be susceptible to uncertainties. Other forms of uncertainty come from computational methods such as assignments of secondary structure elements: Different classifiers that assign structural elements to parts of the amino acid sequence yield different results. Understanding these uncertainties is essential as they are directly impacting the reliability and interpretation of molecular visualizations. Coming back to the earlier example of molecular docking, uncertainties in atomic positions can severely affect the docking process. In such cases, it is not only the most probable structure that matters but also other plausible conformations, as they may influence the outcome and provide a more comprehensive understanding of molecular interactions.
To address these issues and communicate associated uncertainties, the field of UAV has emerged. It focuses on integrating data and its uncertainty into a unified computation and visualization pipeline, ultimately helping users make more informed decisions. This is particularly important because visualization tends to suggest a level of accuracy rarely present in the data [JS03]. However, incorporating uncertainty information into a visualization presents its own challenges. It tends to increase the visual complexity, potentially hindering the perception of the core data [BHJ*14]. In the context of biomolecular structures, UV has been an active area of research for over 30 years, with some of the earliest examples shown in Figure 2. Despite this, existing surveys focus on either specific aspects of molecular visualization or UV in general, with no survey addressing the unique intersection of these two topics.
Thus, this report provides an overview of existing UAV approaches for biomolecular structures. While this is particularly relevant to the study of biomolecules, it also holds mutual benefits for the broader visualization community. Molecular structure data is versatile, complex, and derived from a variety of sources. The techniques developed for visualizing uncertainty can enhance molecular visualization and provide valuable insights for other fields that handle complex and uncertain data. Additionally, innovations in these fields could inspire new methods and improvements in the visualization of uncertainty for biomolecular structures.
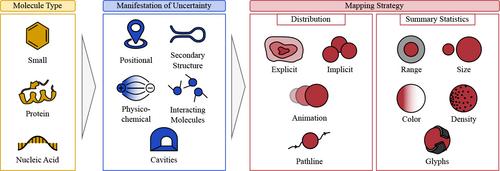
To structure and provide an overview of works on UAV of biomolecular structures, we introduce a classification schema (Figure 1) that categorizes approaches by molecule type, uncertainty manifestation, and uncertainty mapping. This classification allows for a better understanding of the diverse techniques and helps identify trends and gaps in current methodologies. For example, there is a significant lack of UAV techniques for large-scale data, despite the rapid growth of structural datasets. By identifying such gaps, we highlight promising opportunities for advancing the field.
Our survey's main contributions can be summarized as follows:
This report is organized as follows: First, we discuss related surveys (Section 2). Next, we introduce the necessary background on molecular structure visualization (Section 3), and UAV (Section 4). Then, we discuss the scope of this paper in more detail and present our proposed taxonomy for uncertainty-aware visualization approaches for biomolecular structures (Section 5). Section 6, Section 7, and Section 8 then describes the approaches for small molecules, proteins, and nucleic acids, respectively. Afterward, we discuss the existing approaches (Section 9) and future research directions (Section 10) before we conclude this report in Section 11.
While surveys on UV and biomolecular visualization individually are manifold, a comprehensive survey of the intersection of both areas is still missing in the literature. Surveys on biological or biomolecular visualization frequently acknowledge uncertainty but typically address it in a limited scope, often focusing solely on individual aspects. Kozlíková et al. [KKF*17] provide a broad overview of state-of-the-art techniques in biomolecular structure visualization. Their report includes a section on molecular dynamics visualization, covering methods for illustrating biomolecular flexibility and volumetric representations.
Krone et al. [KKL*16] review techniques for visualizing biomolecular cavities, also discussing several sources of uncertainty inherent to this field. They highlight the challenges of visualizing dynamic cavities, which fluctuate over time as molecular structures are inherently dynamic. Additionally, the authors emphasize the need for visualization tools that can compare and evaluate different cavity detection methods, noting significant discrepancies—up to 200%—in volume measurements across tools. Despite these challenges, only a few tools can currently calculate uncertainties in their measurements. The increasing size and complexity of data drive the need for multiscale visualization approaches. The 2019 survey by Miao et al. [MKK*19] explores these multiscale molecular visualization methods and emphasizes the importance of overview visualizations. For this purpose, highly abstracted and/or aggregated UV techniques are featured in their review. The recent review of biomolecular visualization by Li and Wei [LW24] includes a brief section on positional UV, outlining common encodings and some newer techniques.
Since molecular dynamics (MD) simulation computes the dynamic properties of molecules, this topic is closely related to molecular flexibility and positional uncertainty. Belghit et al. [BSD*24] reviewed the visualization of MD trajectories, while Corey et al. [CBC23] specifically reviewed the visualization of MD simulations for membrane systems.
In 1997, Pang et al. [PWL97] developed a classification scheme for early UV approaches. It incorporates properties of the data and visualization themselves, such as its dimensionality and discrete or continuous nature. Additionally, they categorize approaches according to how they add uncertainty information to the visualizations. They identified the methods: glyphs, adding/modifying geometry, modifying attributes, animation, sonification, and psycho-visual. Brodlie et al. [BAOL12] discussed reasons for UV being a difficult problem. One major reason is the complexity of uncertainty itself, with even the terminology of uncertainty often being unclear. For biomolecular UV, for example, uncertainty is often used interchangeably with error, precision, or flexibility. Another difficulty is that uncertainty adds another dimension to a visualization. For one- or two-dimensional data, this makes the visualization more complex but is relatively easily solvable. Most biomolecular structure visualizations are inherently three-dimensional. Thus, adding another dimension—the uncertainty—becomes more challenging. Additionally, they specifically emphasize the distinction of visualization of uncertainty and uncertainty of visualization: Research usually considers the visualization of uncertainty in a dataset. However, the visualization itself—through filtering, mapping, and rendering—adds another layer of uncertainty. Bonneau et al. [BHJ*14] formally describe uncertainty and discuss UV in several fields like medical visualization or weather and climate.
Ensemble visualization is closely related to the visualization of uncertainty. In fact, a common metaphor for indicating uncertainty in biomolecular structures is ensemble visualization. The ensemble visualization survey by Wang et al. [WHLS19] does not explicitly address biomolecular structures; however, several techniques for visualizing ensembles of surfaces or volumes are either currently applied to biomolecular structures or are adaptable for this purpose.
Padilla et al. [PKH21] recently outlined best practices for UV, discussing cognitive theories that explain how these methods affect viewers' judgments. They primarily examined lower-dimensional (1D, 2D) UV, including error bars, icon arrays, and 2D ensemble plots. In their 2006 survey on UV, Griethe and Schumann [GS06] highlighted the scarcity of usability studies as a key gap in the field. Over a decade later, Hullman et al. [HQC*19] conducted an in-depth survey on evaluating UV, identifying several unresolved issues. Notably, they observed a prevalent research bias toward assessing performance accuracy over decision quality. They proposed guidelines for adopting transparent and valid evaluation methods.
Weiskopf [Wei22] discusses UV and illustrates general concepts with examples of biological data visualization. However, his paper is not a systematic survey and because it focuses on biological data in general, only a few molecular structure visualizations are featured. Therefore, a comprehensive overview of uncertainty in biomolecular structure visualization is still missing in the literature.
In this section, we provide a brief overview of molecular structure visualization. We begin with a summary of biomolecules (Section 3.1), followed by the description of various methods for acquiring biomolecular structure data (Section 3.2). Finally, we discuss molecular representation models (Section 3.3). We provide only brief overviews of these topics; for more in-depth information on biomolecules and biomolecular data acquisition, please see Nelson and Cox [NC21], Berg et al. [BTS10], and Alberts et al. [AHJ*22]. Further information on representation models and visualization can be found in the report by Kozlíková et al. [KKF*17].
Uncertainty visualization (UV) focuses on explicitly representing errors or uncertainty in the data. Uncertainty-aware visualization (UAV) builds on this by integrating the visualization of uncertainty directly with the data itself, ensuring both are effectively represented [GSWS21]. Here, we focus on the latter approach, where the data and its uncertainty are visualized together. However, such visualizations are often still referred to as UV. In this section, we outline potential sources of uncertainty (Section 4.1), discuss how these map to biomolecular data (Section 4.2), introduce common mapping strategies for visualizing uncertainties (Section 4.3), and discuss specifics of uncertainty visualization for biomolecular data and commonalities with other domains (Section 4.4).
Next, we specify our scope and selection process (Section 5.1) and detail our classification schema (Section 5.2).
While the methods discussed in this section are illustrated with small molecules, they are not inherently restricted to them. Certain techniques, particularly those that rely on ball-and-stick representations, may not be optimal for larger molecules, though theoretically, they could still be used. On the other hand, methods employing volume visualization should be more readily applicable to various types of biomolecules.
Explicit In 1999, Rheingans and Joshi were the first to write a publication explicitly about molecular UV [RJ99]. They proposed three options for visualizing molecules with positional uncertainty (Figure 2). Two methods are based on a likelihood volume computed from the ensemble. The likelihood volume stores the probability of an atom being at each voxel. They gave two options for visualizing this volume. The first volume visualization extracts transparent isosurfaces from the volume and renders them on top of the opaque ball-and-stick visualization (Figure 2b). The other volume visualization method renders the volume directly, resulting in a cloud-like appearance (Figure 2c). The third method superposes each conformer in the ensemble using its ball-and-stick representation. Each conformation can either be rendered opaquely, or semi-transparently (Figure 2a) so that more certain regions appear opaque while uncertain regions appear more transparent.
Schmidt-Ehrenberg et al. [SBH02] used direct volume rendering (DVR) or opaque isosurfaces to display likelihood volumes. They focused on metastable conformations, which are states in which the molecule stays for a long time. Therefore, they visualized several metastable conformations of a molecule at once, while also displaying the likelihood volume for each of the metastable conformations separately.
Implicit Best and Hege [BH02] let users cluster groups of atoms into ellipsoids in their application to reduce clutter and thus ease the detection of conformational changes. Additionally, they blended several time frames of a molecular simulation to facilitate detecting large changes. Similar to the implicit mapping proposed by Rheingans and Joshi [RJ99], Sabando et al. [SUS*21] visualized chemical compound similarity by layering semi-transparent visualizations of individual conformations. They added an option to invert the opacity. As a result, more uncertain parts of the molecule can be highlighted by appearing more opaque.
Ranges Knoll et al. [KCL*13] defined the interval between the chemical bond radii and the vdW radii as an uncertainty interval over a charge density distribution. They rendered the molecules in black using the ball-and-stick representation. Then, they overlaid a visualization of an electron density volume. They used DVR with a custom transfer function. In most of their examples, they used two peaks for displaying the isolevel of chemical bonds in blue and the isolevel corresponding to the vdW radii in red. In their paper, they focused on molecular interfaces rather than biomolecules. Due to using the ball-and-stick representation, their visualization is suited to small molecules rather than larger biomolecules.
Size Wagner and Himmel [WH17] used color and size to encode the RMSD between two molecular structures in a modified ball-and-stick representation. The sphere color indicates the atom pair's absolute RMSD. The sphere size is proportional to the relative contribution of the atom pair to the total RMSD.
The methods developed for small molecules generally provide overview visualizations of uncertainty. They indicate the presence of uncertainty in the molecule and give a rough sense of its magnitude. However, apart from the combined color and size coding by Wagner and Himmel [WH17], making more detailed judgments is likely challenging. These methods also do not facilitate compare or integrate tasks.
Proteins are the most extensively studied biomolecules for UV, with visualizations available for all types of uncertainty manifestations and mappings according to our schema. Similar to small molecules, many methods for UV apply to other biomolecule types. Nonetheless, certain techniques are specific to proteins, such as the visualization of secondary structures or cavities.
Most papers about nucleic acids focus on visualizing RNA. Only two papers specifically visualized DNA.
In the following, we will discuss patterns and trends of UV techniques for biomolecular structures. Figure 12 shows a parallel sets plot [KBH06] of the distribution and correlation of the collected literature's attributes along our schemas main dimensions. In the visualization, the dimensions—molecule type, manifestation, and mapping—are represented with consistent total contributions across layers. However, papers often vary in the number of applicable categories per dimension. We distribute each paper's contribution equally among the applicable categories within a given dimension. For example, if a paper employs three mapping strategies, each mapping receives a proportional width of 1/3 of the paper's total contribution. Conversely, a paper with only one mapping allocates its full contribution to that mapping. This strategy ensures that each paper contributes equally to the total width per dimension.
In the previous chapter, we explored trends and outlined various challenges in the field. Here, we narrow our focus and highlight a few areas we consider the most important for future research.
Complex and Multiscale Systems Advances in imaging technologies enable the visualization of increasingly complex systems. While some approaches exist for visualizing systems of interacting molecules, such as protein-ligand interactions, there is significant room for improvement. UAV for even larger systems, such as mesoscale structures or visualizations spanning multiple scales, remain largely unexplored. Methods that work well for small to medium-sized molecular structures often become cluttered or impractical when applied to more complex systems. This highlights the need for approaches that can effectively manage the scale and complexity of these data. A potential solution is adopting more abstract and illustrative visualization techniques. These approaches could offer clearer, more interpretable visualizations while addressing the unique challenges of complex molecular systems.
Conformational Space While there is already a substantial amount of literature visualizing the conformational space, the problem remains challenging, particularly for larger molecules, as existing techniques often become cluttered and difficult to interpret. Initial efforts to enhance these visualizations were undertaken by Melvin et al. [MS16], who employed focus and context, as well as a deliberately selected subset of conformations, to reduce visual complexity. Nevertheless, easily comprehensible visualizations of the entire conformational space remain scarce. Similar to the visualization of complex systems, the volume and complexity of the data can be overwhelming. However, the multidimensional nature of conformational spaces introduces additional challenges. As with complex systems, abstraction and illustrative techniques offer promising solutions. Simplified representations that emphasize key states or transitions could enhance clarity, while interactive tools for exploring specific regions of the conformational landscape could improve usability. Alternatively, animations—similar to HOPs [Hul16]—could dynamically represent conformational changes, reducing the need to convey all information within a single, static visualization.
Comparison Techniques Comparing molecular configurations and their uncertainties typically involves side-by-side visualizations or simple overlays. These methods are effective for small datasets but become impractical as the number of molecules increases. Overlays face challenges similar to visualizing conformational space, such as becoming cluttered and difficult to interpret. This issue is especially problematic when comparing dynamic molecules. Ensembles of molecular dynamics (MD) simulations have become crucial for addressing the lack of reproducibility in individual simulations [WSC21]. However, MD ensembles generate vast amounts of data, requiring new visualization techniques capable of handling this complexity without overwhelming users. This challenge was also highlighted by Belghit et al. [BSD*24]. This scalability problem is not limited to biomolecular systems; it also affects broader ensemble visualization methods [WHLS19]. Advancements in both fields could offer mutual benefits, leading to better solutions for visualizing large, complex datasets.
Nucleic Acids Despite being the focus of numerous current research topics [WEFC21,BJZ*22, WD23], nucleic acids are often underrepresented in terms of specialized UV techniques. Current visualizations primarily focus on base pair probabilities and rely on relatively simple methods. While these approaches provide some insight into nucleic acid structure, they are limited in scope and fail to capture the full complexity of these molecules. Comprehensive 3D visualizations, which could provide a more complete representation of nucleic acid structures, are largely absent. Additionally, visualizing the conformational space of nucleic acids remains a significant gap despite its importance for understanding molecular dynamics, interactions, and function.
Evaluation UV techniques for biomolecular structures are not being evaluated rigorously enough. For example, it is crucial to determine which methods are most intuitive for viewers, how effectively they support the inference of quantitative values, and whether they accurately represent the conformational space of biomolecules. Since humans often reason in non-intuitive ways when interpreting uncertainty [PKH21], it is essential to rigorously evaluate uncertainty visualizations to ensure they effectively support accurate understanding and decision-making. Evaluating UV methods is inherently challenging [Hul16], even for simple 1D and 2D visualizations. Incorporating and evaluating uncertainty in the context of 3D biomolecular structure visualizations is even more complex. However, addressing this gap is essential. It will enable practitioners to choose the most suitable methods for specific problems, identify shortcomings in existing techniques, and drive the development of new methods that better meet the demands of UAV.
In this report, we presented UAV approaches for biomolecular structures, classifying the methods along three primary dimensions: molecule type, manifestation of uncertainty, and mapping strategy. While these methods demonstrate strategies for representing uncertainty for individual molecules, they often fall short of addressing the demands of modern biomolecular research. The constantly increasing size and complexity of biomolecular datasets require visualization techniques that scale effectively and remain interpretable. Current approaches frequently appear cluttered even for small to medium-sized molecules, making them unsuitable for larger systems such as mesoscale data or ensembles of dynamic structures. These gaps highlight the need for innovative visualization strategies that can handle the complexity and scale of modern biomolecular data. Advancing UAV methods is essential for improving how researchers interpret and interact with complex biomolecular data, enabling clearer insights and more informed decision-making. Given the parallels to other domains, such as general uncertainty and ensemble visualization, advancements in UAV for biomolecular structures are likely to have a broader impact, benefiting the entire field of UAV.
We want to thank Frank Cordes, Ute Hellmich, Philipp Schnee, Philipp Thiel, Markus Weber, and Christoph Wiedemann for the insightful discussions on UV for biomolecular structures. We would also like to thank Katarína Furmanová, Barbora Kozlíková, and Robin Skånberg for sharing images with us for this report. This work was partially funded by the Deutsche Forschungsgemeinschaft (DFG, German Research Foundation) — Project-ID 437702916. Open Access funding enabled and organized by Projekt DEAL.
期刊介绍:
Computer Graphics Forum is the official journal of Eurographics, published in cooperation with Wiley-Blackwell, and is a unique, international source of information for computer graphics professionals interested in graphics developments worldwide. It is now one of the leading journals for researchers, developers and users of computer graphics in both commercial and academic environments. The journal reports on the latest developments in the field throughout the world and covers all aspects of the theory, practice and application of computer graphics.
 求助内容:
求助内容: 应助结果提醒方式:


