Explaining machine learning models trained to predict Copernicus DEM errors in different land cover environments
IF 4.2
引用次数: 0
Abstract
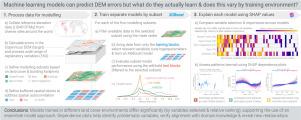
Machine learning models are increasingly used to correct the vertical biases (mainly due to vegetation and buildings) in global Digital Elevation Models (DEMs), for downstream applications which need “bare earth” elevations. The predictive accuracy of these models has improved significantly as more flexible model architectures are developed and new explanatory datasets produced, leading to the recent release of three model-corrected DEMs (FABDEM, DiluviumDEM and FathomDEM). However, there has been relatively little focus so far on explaining or interrogating these models, especially important in this context given their downstream impact on many other applications (including natural hazard simulations). In this study we train five separate models (by land cover environment) to correct vertical biases in the Copernicus DEM and then explain them using SHapley Additive exPlanation (SHAP) values. Comparing the models, we find significant variation in terms of the specific input variables selected and their relative importance, suggesting that an ensemble of models (specialising by land cover) is likely preferable to a general model applied everywhere. Visualising the patterns learned by the models (using SHAP dependence plots) provides further insights, building confidence in some cases (where patterns are consistent with domain knowledge and past studies) and highlighting potentially problematic variables in others (such as proxy relationships which may not apply in new application sites). Our results have implications for future DEM error prediction studies, particularly in evaluating a very wide range of potential input variables (160 candidates) drawn from topographic, multispectral, Synthetic Aperture Radar, vegetation, climate and urbanisation datasets.
解释机器学习模型训练预测哥白尼DEM误差在不同的土地覆盖环境
机器学习模型越来越多地用于纠正全球数字高程模型(dem)中的垂直偏差(主要是由于植被和建筑物),用于需要“裸地”高程的下游应用。随着更灵活的模型架构的开发和新的解释性数据集的产生,这些模型的预测精度得到了显著提高,导致最近发布了三种模型修正的dem (FABDEM, DiluviumDEM和FathomDEM)。然而,到目前为止,对这些模型的解释或质疑相对较少,特别是考虑到它们对许多其他应用(包括自然灾害模拟)的下游影响,这些模型在这种情况下尤为重要。在这项研究中,我们训练了五个独立的模型(按土地覆盖环境)来纠正哥白尼DEM中的垂直偏差,然后使用SHapley加性解释(SHAP)值对它们进行解释。比较这些模型,我们发现在选择的特定输入变量及其相对重要性方面存在显著差异,这表明模型的集合(按土地覆盖专门划分)可能比到处应用的一般模型更可取。可视化模型学习的模式(使用SHAP依赖图)提供了进一步的见解,在某些情况下(模式与领域知识和过去的研究一致)建立信心,并突出显示其他情况下潜在的问题变量(例如可能不适用于新应用程序站点的代理关系)。我们的研究结果对未来的DEM误差预测研究具有重要意义,特别是在评估从地形、多光谱、合成孔径雷达、植被、气候和城市化数据集提取的非常广泛的潜在输入变量(160个候选变量)方面。
本文章由计算机程序翻译,如有差异,请以英文原文为准。
求助全文
约1分钟内获得全文
求助全文

 求助内容:
求助内容: 应助结果提醒方式:


