{"title":"Calculating genetic risk scores directly from summary statistics with an application to type 1 diabetes.","authors":"Steven Squires, Michael N Weedon, Richard A Oram","doi":"10.1093/bioadv/vbaf158","DOIUrl":null,"url":null,"abstract":"<p><strong>Motivation: </strong>Genetic risk scores (GRS) summarise genetic data into a single number and allow for discrimination between cases and controls. Many applications of GRSs would benefit from comparisons with multiple datasets to assess quality of the GRS across different groups. However, genetic data is often unavailable. If summary statistics of the genetic data could be used to calculate GRSs more comparisons could be made, potentially leading to improved research.</p><p><strong>Results: </strong>We present a methodology that utilises only summary statistics of genetic data to calculate GRSs with an example of a type 1 diabetes (T1D) GRS. An example on European populations of the mean T1D GRS for those calculated from genetic data and from summary statistics (our method) was 10.31 (10.12-10.48) and 10.38 (10.24-10.53), respectively. An example of a case-control set for T1D has an area under the receiver operating characteristic curve of 0.917 (0.903-0.93) for those calculated from genetic data and 0.914 (0.898-0.929) for those calculated from summary statistics.</p><p><strong>Availability: </strong>The code is available at https://github.com/stevensquires/simulating_genetic_risk_scores.</p>","PeriodicalId":72368,"journal":{"name":"Bioinformatics advances","volume":"5 1","pages":"vbaf158"},"PeriodicalIF":2.8000,"publicationDate":"2025-07-02","publicationTypes":"Journal Article","fieldsOfStudy":null,"isOpenAccess":false,"openAccessPdf":"https://www.ncbi.nlm.nih.gov/pmc/articles/PMC12270265/pdf/","citationCount":"0","resultStr":null,"platform":"Semanticscholar","paperid":null,"PeriodicalName":"Bioinformatics advances","FirstCategoryId":"1085","ListUrlMain":"https://doi.org/10.1093/bioadv/vbaf158","RegionNum":0,"RegionCategory":null,"ArticlePicture":[],"TitleCN":null,"AbstractTextCN":null,"PMCID":null,"EPubDate":"2025/1/1 0:00:00","PubModel":"eCollection","JCR":"Q2","JCRName":"MATHEMATICAL & COMPUTATIONAL BIOLOGY","Score":null,"Total":0}
引用次数: 0
Abstract
Motivation: Genetic risk scores (GRS) summarise genetic data into a single number and allow for discrimination between cases and controls. Many applications of GRSs would benefit from comparisons with multiple datasets to assess quality of the GRS across different groups. However, genetic data is often unavailable. If summary statistics of the genetic data could be used to calculate GRSs more comparisons could be made, potentially leading to improved research.
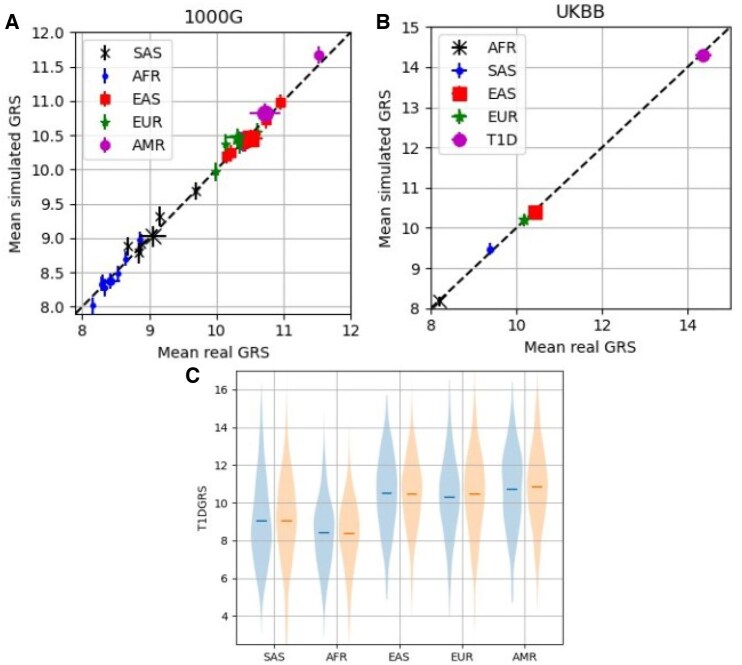
Results: We present a methodology that utilises only summary statistics of genetic data to calculate GRSs with an example of a type 1 diabetes (T1D) GRS. An example on European populations of the mean T1D GRS for those calculated from genetic data and from summary statistics (our method) was 10.31 (10.12-10.48) and 10.38 (10.24-10.53), respectively. An example of a case-control set for T1D has an area under the receiver operating characteristic curve of 0.917 (0.903-0.93) for those calculated from genetic data and 0.914 (0.898-0.929) for those calculated from summary statistics.
Availability: The code is available at https://github.com/stevensquires/simulating_genetic_risk_scores.

 求助内容:
求助内容: 应助结果提醒方式:


