{"title":"Potential Factors Associated With Commercial-to-Medicare Relative Prices at the Substate Level.","authors":"Fredric Blavin, John Holahan","doi":"10.1001/jamahealthforum.2025.1640","DOIUrl":null,"url":null,"abstract":"<p><strong>Importance: </strong>There is a growing consensus that commercial prices vary in ways that do not reflect quality of care and are a key factor in high health care spending in the US.</p><p><strong>Objective: </strong>To assess the geographic variation in commercial prices relative to Medicare rates for both hospital and professional services at the state and substate levels, estimate the change in these prices and determine which characteristics are associated with higher hospital prices.</p><p><strong>Design, setting, and participants: </strong>This cross-sectional study analyzed deidentified aggregated health care claims data for 2 time frames of service, from January 1, 2020, through December 31, 2020, and from June 1, 2022, through May 31, 2023, to construct commercial-to-Medicare price ratios for hospital and professional services at the state and geozip levels (491 geozips correspond to combinations of zip codes in 50 states and the District of Columbia). Multivariable regression models were estimated to assess the association between commercial-to-Medicare relative hospital prices and various market characteristics at the geozip level. Data analysis was conducted from July through November 2024.</p><p><strong>Exposures: </strong>Exposures defined at the geozip level included hospital and insurer market concentrations, the share of hospitals beds associated with nonprofit hospitals, the share of beds associated with health systems, the presence of a major teaching hospital, mean household income, the share of the population who had public health insurance, and the share who were uninsured.</p><p><strong>Main outcomes and measures: </strong>Commercial prices relative to Medicare rates for inpatient, outpatient, combined hospital, and professional services.</p><p><strong>Results: </strong>This cross-sectional study of 1.2 billion claim lines in 2020 and 1.5 billion claim lines from June 2022 through May 2023 found that private insurers' in-network allowed amounts were 246% (ratio [SD], 2.46 [0.6]) of the Medicare rates for hospital services and 124% (ratio [SD], 1.24 [0.3]) of the Medicare rates for professional services. The mean commercial-to-Medicare price ratio for professional services slightly declined from 2020 to 2022-2023, while the mean (SD) price ratio for hospital services increased by 5.5%, from 2.34 (0.5) in 2020 to 2.46 (0.6) in 2022-2023. There was substantial variation in the commercial-to-Medicare price ratios across states and geozips. Geozips with very high hospital market concentration levels (Herfindahl-Hirschman Index [HHI]>3500) were associated with a commercial-to-Medicare price ratio higher by 0.21 (95% CI, 0.02-0.39; P = .03) relative to geozips with HHI levels lower than 1500, which represents an 8.4% increase above the 2022-2023 mean. High insurer concentration was negatively associated with the commercial-to-Medicare hospital price ratios (-0.13; 95% CI, -0.26 to 0.01; P = .04), whereas having a major teaching hospital in the geozip (0.20; 95% CI, 0.06-0.34; P = .01), being in the highest household income quartile (0.35; 95% CI, 0.13-0.57; P = .002), and the share of the population who were uninsured (0.03; 95% CI, 0.01-0.05; P < .001) were positively associated with price ratios.</p><p><strong>Conclusions and relevance: </strong>Examination of a major claims database revealed substantial geographic variation in commercial-to-Medicare price ratios and increases in the price ratio for hospital services over time. Substate market and hospital characteristics were also associated with higher commercial-to-Medicare relative prices. These factors, including high hospital market concentration, could be used to identify and target specific areas more amenable to policies aimed at curbing hospital price growth.</p>","PeriodicalId":53180,"journal":{"name":"JAMA Health Forum","volume":"6 7","pages":"e251640"},"PeriodicalIF":11.3000,"publicationDate":"2025-07-03","publicationTypes":"Journal Article","fieldsOfStudy":null,"isOpenAccess":false,"openAccessPdf":"https://www.ncbi.nlm.nih.gov/pmc/articles/PMC12232185/pdf/","citationCount":"0","resultStr":null,"platform":"Semanticscholar","paperid":null,"PeriodicalName":"JAMA Health Forum","FirstCategoryId":"1085","ListUrlMain":"https://doi.org/10.1001/jamahealthforum.2025.1640","RegionNum":0,"RegionCategory":null,"ArticlePicture":[],"TitleCN":null,"AbstractTextCN":null,"PMCID":null,"EPubDate":"","PubModel":"","JCR":"Q1","JCRName":"HEALTH CARE SCIENCES & SERVICES","Score":null,"Total":0}
引用次数: 0
Abstract
Importance: There is a growing consensus that commercial prices vary in ways that do not reflect quality of care and are a key factor in high health care spending in the US.
Objective: To assess the geographic variation in commercial prices relative to Medicare rates for both hospital and professional services at the state and substate levels, estimate the change in these prices and determine which characteristics are associated with higher hospital prices.
Design, setting, and participants: This cross-sectional study analyzed deidentified aggregated health care claims data for 2 time frames of service, from January 1, 2020, through December 31, 2020, and from June 1, 2022, through May 31, 2023, to construct commercial-to-Medicare price ratios for hospital and professional services at the state and geozip levels (491 geozips correspond to combinations of zip codes in 50 states and the District of Columbia). Multivariable regression models were estimated to assess the association between commercial-to-Medicare relative hospital prices and various market characteristics at the geozip level. Data analysis was conducted from July through November 2024.
Exposures: Exposures defined at the geozip level included hospital and insurer market concentrations, the share of hospitals beds associated with nonprofit hospitals, the share of beds associated with health systems, the presence of a major teaching hospital, mean household income, the share of the population who had public health insurance, and the share who were uninsured.
Main outcomes and measures: Commercial prices relative to Medicare rates for inpatient, outpatient, combined hospital, and professional services.
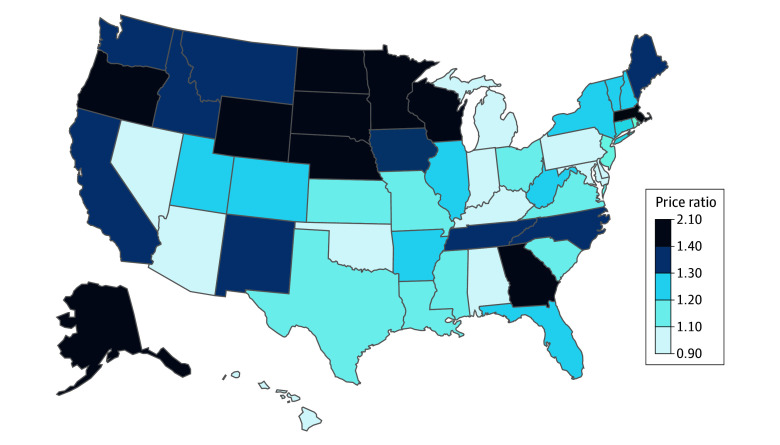
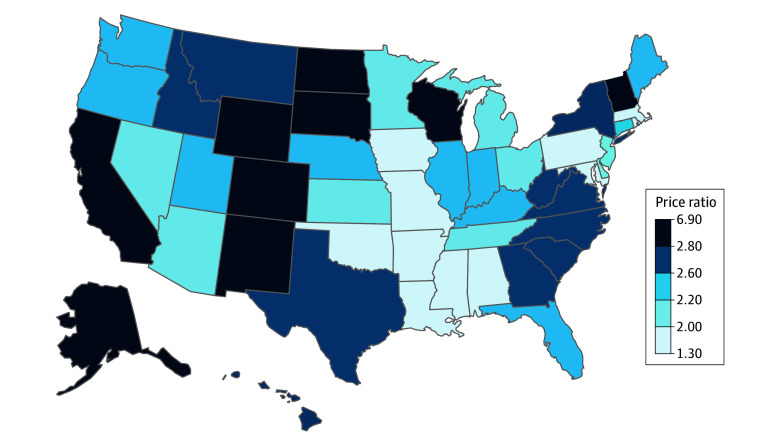
Results: This cross-sectional study of 1.2 billion claim lines in 2020 and 1.5 billion claim lines from June 2022 through May 2023 found that private insurers' in-network allowed amounts were 246% (ratio [SD], 2.46 [0.6]) of the Medicare rates for hospital services and 124% (ratio [SD], 1.24 [0.3]) of the Medicare rates for professional services. The mean commercial-to-Medicare price ratio for professional services slightly declined from 2020 to 2022-2023, while the mean (SD) price ratio for hospital services increased by 5.5%, from 2.34 (0.5) in 2020 to 2.46 (0.6) in 2022-2023. There was substantial variation in the commercial-to-Medicare price ratios across states and geozips. Geozips with very high hospital market concentration levels (Herfindahl-Hirschman Index [HHI]>3500) were associated with a commercial-to-Medicare price ratio higher by 0.21 (95% CI, 0.02-0.39; P = .03) relative to geozips with HHI levels lower than 1500, which represents an 8.4% increase above the 2022-2023 mean. High insurer concentration was negatively associated with the commercial-to-Medicare hospital price ratios (-0.13; 95% CI, -0.26 to 0.01; P = .04), whereas having a major teaching hospital in the geozip (0.20; 95% CI, 0.06-0.34; P = .01), being in the highest household income quartile (0.35; 95% CI, 0.13-0.57; P = .002), and the share of the population who were uninsured (0.03; 95% CI, 0.01-0.05; P < .001) were positively associated with price ratios.
Conclusions and relevance: Examination of a major claims database revealed substantial geographic variation in commercial-to-Medicare price ratios and increases in the price ratio for hospital services over time. Substate market and hospital characteristics were also associated with higher commercial-to-Medicare relative prices. These factors, including high hospital market concentration, could be used to identify and target specific areas more amenable to policies aimed at curbing hospital price growth.
期刊介绍:
JAMA Health Forum is an international, peer-reviewed, online, open access journal that addresses health policy and strategies affecting medicine, health, and health care. The journal publishes original research, evidence-based reports, and opinion about national and global health policy. It covers innovative approaches to health care delivery and health care economics, access, quality, safety, equity, and reform.
In addition to publishing articles, JAMA Health Forum also features commentary from health policy leaders on the JAMA Forum. It covers news briefs on major reports released by government agencies, foundations, health policy think tanks, and other policy-focused organizations.
JAMA Health Forum is a member of the JAMA Network, which is a consortium of peer-reviewed, general medical and specialty publications. The journal presents curated health policy content from across the JAMA Network, including journals such as JAMA and JAMA Internal Medicine.

 求助内容:
求助内容: 应助结果提醒方式:


