{"title":"Blastn2dotplots: multiple dot-plot visualizer for genome comparisons.","authors":"Miki Okuno, Takeshi Yamamoto, Yoshitoshi Ogura","doi":"10.1186/s12859-025-06175-4","DOIUrl":null,"url":null,"abstract":"<p><strong>Background: </strong>Dot-plots, along with linear comparisons, are fundamental visualization methods in genome comparisons, widely used for analyzing structural variations, repeat regions, and sequence similarities. However, existing tools often have limitations in visualization flexibility, particularly requiring the concatenation of multiple sequences into a single continuous axis. This constraint can make it difficult to apply highlights or user-defined grid lines effectively, reducing interpretability in comparative genomic analyses.</p><p><strong>Results: </strong>We developed blastn2dotplots, a Python 3-based tool that utilizes the Matplotlib library to generate customizable dot-plots from local blastn results. Unlike traditional approaches, blastn2dotplots treats each alignment as a separate subplot, allowing for independent axis labeling, adjustable spacing between plots, and enhanced visualization flexibility. Users can highlight specific regions of interest, apply custom grid lines, and tailor the display to suit different genomic analyses. This tool is particularly useful for chromosomal structure analyses, detection of horizontal gene transfer events, and visualization of repetitive elements, offering an intuitive and adaptable framework for sequence comparison.</p><p><strong>Conclusions: </strong>By addressing key limitations of existing dot-plot visualization tools, blastn2dotplots enhances the clarity and flexibility of comparative genomic analyses. Its ability to handle multiple alignments separately while preserving independent axis control and customization options makes it a valuable resource for a wide range of genomic studies. This tool provides a novel and effective solution for researchers needing precise and adaptable visualization of sequence alignments, thereby maximizing the potential of dot-plots in bioinformatics.</p>","PeriodicalId":8958,"journal":{"name":"BMC Bioinformatics","volume":"26 1","pages":"146"},"PeriodicalIF":3.3000,"publicationDate":"2025-06-02","publicationTypes":"Journal Article","fieldsOfStudy":null,"isOpenAccess":false,"openAccessPdf":"https://www.ncbi.nlm.nih.gov/pmc/articles/PMC12131419/pdf/","citationCount":"0","resultStr":null,"platform":"Semanticscholar","paperid":null,"PeriodicalName":"BMC Bioinformatics","FirstCategoryId":"99","ListUrlMain":"https://doi.org/10.1186/s12859-025-06175-4","RegionNum":3,"RegionCategory":"生物学","ArticlePicture":[],"TitleCN":null,"AbstractTextCN":null,"PMCID":null,"EPubDate":"","PubModel":"","JCR":"Q2","JCRName":"BIOCHEMICAL RESEARCH METHODS","Score":null,"Total":0}
引用次数: 0
Abstract
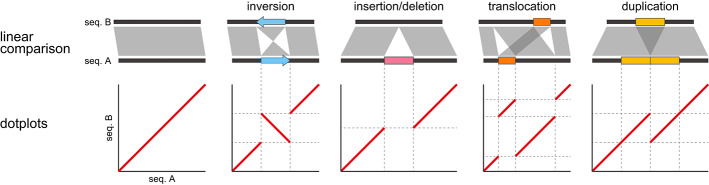
Background: Dot-plots, along with linear comparisons, are fundamental visualization methods in genome comparisons, widely used for analyzing structural variations, repeat regions, and sequence similarities. However, existing tools often have limitations in visualization flexibility, particularly requiring the concatenation of multiple sequences into a single continuous axis. This constraint can make it difficult to apply highlights or user-defined grid lines effectively, reducing interpretability in comparative genomic analyses.
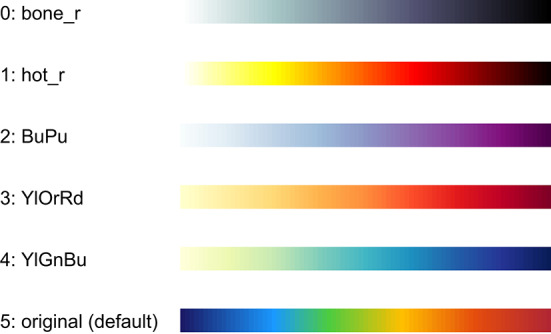
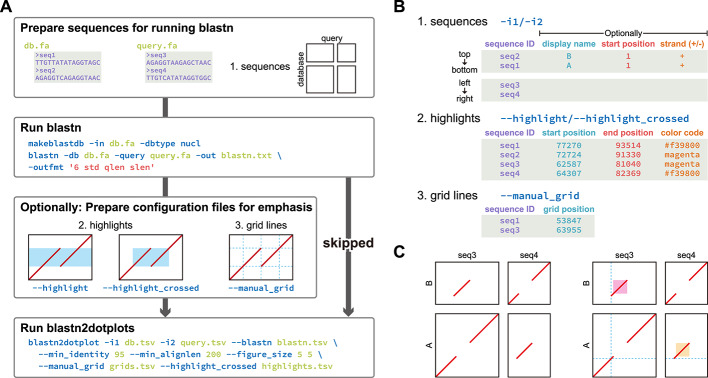
Results: We developed blastn2dotplots, a Python 3-based tool that utilizes the Matplotlib library to generate customizable dot-plots from local blastn results. Unlike traditional approaches, blastn2dotplots treats each alignment as a separate subplot, allowing for independent axis labeling, adjustable spacing between plots, and enhanced visualization flexibility. Users can highlight specific regions of interest, apply custom grid lines, and tailor the display to suit different genomic analyses. This tool is particularly useful for chromosomal structure analyses, detection of horizontal gene transfer events, and visualization of repetitive elements, offering an intuitive and adaptable framework for sequence comparison.
Conclusions: By addressing key limitations of existing dot-plot visualization tools, blastn2dotplots enhances the clarity and flexibility of comparative genomic analyses. Its ability to handle multiple alignments separately while preserving independent axis control and customization options makes it a valuable resource for a wide range of genomic studies. This tool provides a novel and effective solution for researchers needing precise and adaptable visualization of sequence alignments, thereby maximizing the potential of dot-plots in bioinformatics.
期刊介绍:
BMC Bioinformatics is an open access, peer-reviewed journal that considers articles on all aspects of the development, testing and novel application of computational and statistical methods for the modeling and analysis of all kinds of biological data, as well as other areas of computational biology.
BMC Bioinformatics is part of the BMC series which publishes subject-specific journals focused on the needs of individual research communities across all areas of biology and medicine. We offer an efficient, fair and friendly peer review service, and are committed to publishing all sound science, provided that there is some advance in knowledge presented by the work.
 求助内容:
求助内容: 应助结果提醒方式:


