Wei-Chen Ji, You-Li Tian, Hao-Dong Fu, Gen-Han Zha, Cheng-Xi Cao, Li Wei, Qiang Zhang
{"title":"[Rapid identification and analysis of hemoglobin isoelectric focusing electrophoresis images based on deep learning].","authors":"Wei-Chen Ji, You-Li Tian, Hao-Dong Fu, Gen-Han Zha, Cheng-Xi Cao, Li Wei, Qiang Zhang","doi":"10.3724/SP.J.1123.2024.05012","DOIUrl":null,"url":null,"abstract":"<p><p>Gel electrophoresis is used to separate and analyze macromolecules (such as DNA, RNA, and proteins) and their fragments, and highly reproducible and efficient automatic band-detection methods have been developed to analyze gel images. Uneven background, low contrast, lane distortion, blurred band edges, and geometric deformation pose detection-accuracy challenges during automatic band detection. In order to address these issues, various correction algorithms have been proposed; however, these algorithms rely on researcher experience to adjust and optimize parameters based on image characteristics, which introduces human error while qualitatively and quantitatively processing bands. Isoelectric focusing (IEF) gel electrophoresis separates proteins with high-resolution based on isoelectric point (pI) differences. Microarray IEF (mIEF) is used for the auxiliary diagnosis of diabetes and adult <i>β</i>-thalassemia owing to operational ease, low sample consumption, and high throughout. This diagnostic method relies on accurately positioning and precisely determining protein bands. To avoid errors associated with correction algorithms during band analysis, this paper introduces a method for rapidly recognizing bands in gel electrophoresis patterns that relies on a deep learning object detection algorithm, and uses it to quantify and classify the IEF electrophoresis pattern of hemoglobin (Hb). We used mIEF experiments to collect 1 665 pI-marker-free Hb IEF images as a model dataset to train the YOLOv8 model. The trained model accepts a Hb IEF image as input and infers band bounding boxes and classification results. Using inference data, the gray intensities of the pixels in each band area are summed to determine the content of each protein. The background and foreground of the image need to be separated prior to summing the abovementioned gray intensities, and the threshold method is used to achieve this. The threshold is defined as the average intensity of the background area, which is obtained by summing and averaging the background intensities of gel areas between the detection bounding boxes of each protein band. The baseline band areas are unified after removing the background. This method only requires the input image, directly outputs the corresponding electrophoretic band information, and does not rely on the experience of professionals nor is it affected by factors such as lane distortion or band deformation. In addition, the developed method does not depend on pI markers for qualitatively determining bands, thereby reducing experimental costs and improving detection efficiency. YOLOv8n delivered a detection accuracy of 92.9% and an inference time of 0.6 ms while using limited computing resources. Using Hb A2 as an example, we compared its content measured using the developed method with clinical data. The quantitative results were subjected to regression analysis, which delivered a linearity of 0.981 2 and a correlation coefficient of 0.980 0. We also used the Bland-Altman analysis method to verify that these two values are highly consistent. Compared with the traditional automatic band detection methods, the method developed in this study is fast, accurate, more repeatable, and stable, and can be used to determine the Hb A2 content in clinical practice, thereby potentially assisting in the auxiliary diagnosis of adult <i>β</i>-thalassemia.</p>","PeriodicalId":101336,"journal":{"name":"Se pu = Chinese journal of chromatography","volume":"43 6","pages":"696-704"},"PeriodicalIF":0.0000,"publicationDate":"2025-06-01","publicationTypes":"Journal Article","fieldsOfStudy":null,"isOpenAccess":false,"openAccessPdf":"https://www.ncbi.nlm.nih.gov/pmc/articles/PMC12093207/pdf/","citationCount":"0","resultStr":null,"platform":"Semanticscholar","paperid":null,"PeriodicalName":"Se pu = Chinese journal of chromatography","FirstCategoryId":"1085","ListUrlMain":"https://doi.org/10.3724/SP.J.1123.2024.05012","RegionNum":0,"RegionCategory":null,"ArticlePicture":[],"TitleCN":null,"AbstractTextCN":null,"PMCID":null,"EPubDate":"","PubModel":"","JCR":"","JCRName":"","Score":null,"Total":0}
引用次数: 0
Abstract
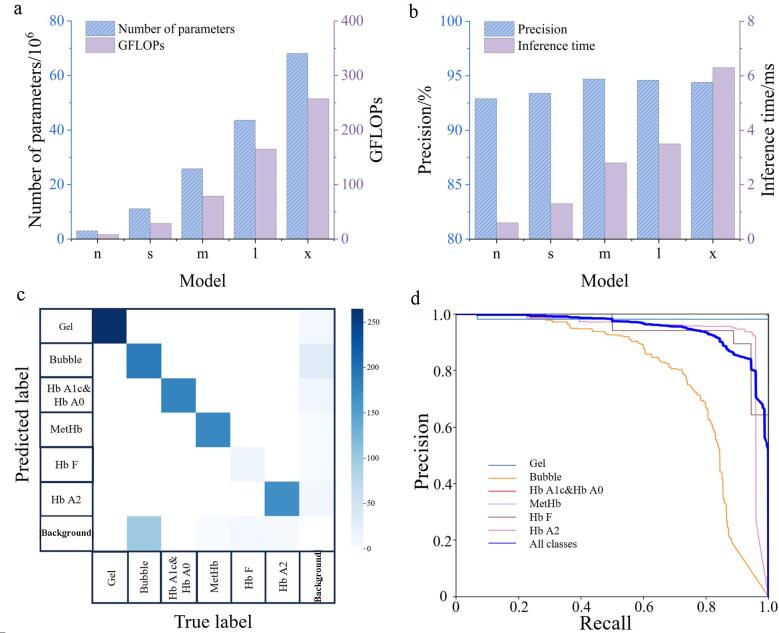
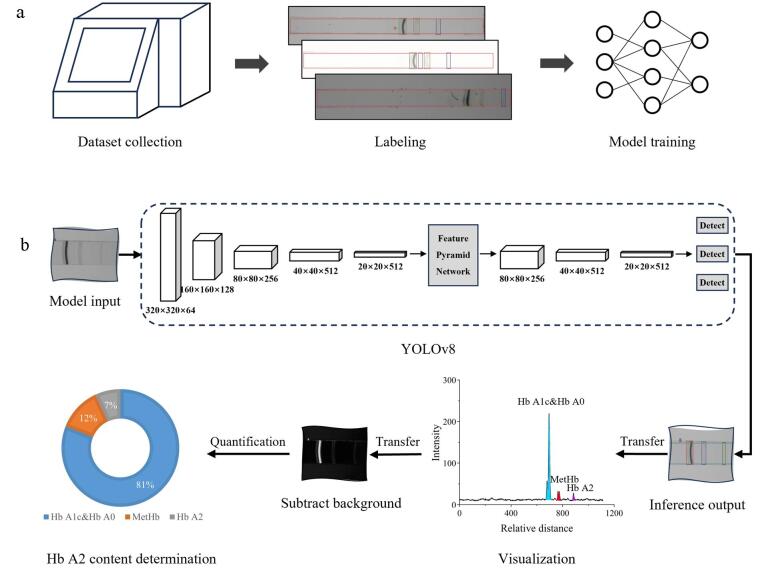
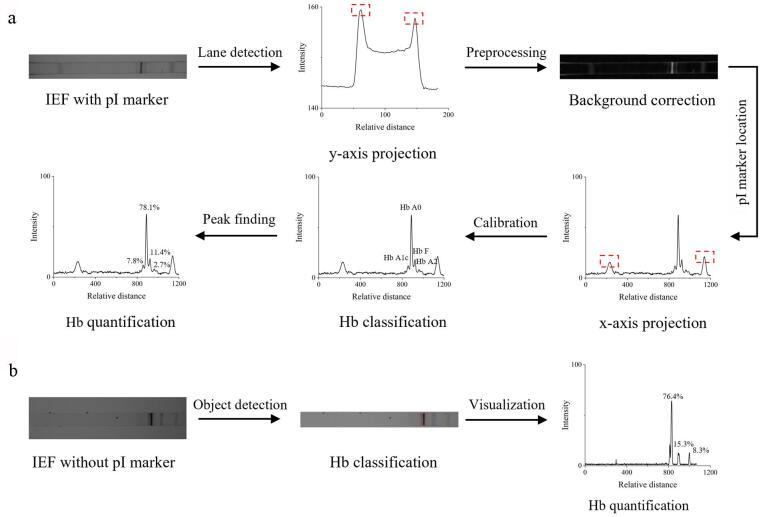
Gel electrophoresis is used to separate and analyze macromolecules (such as DNA, RNA, and proteins) and their fragments, and highly reproducible and efficient automatic band-detection methods have been developed to analyze gel images. Uneven background, low contrast, lane distortion, blurred band edges, and geometric deformation pose detection-accuracy challenges during automatic band detection. In order to address these issues, various correction algorithms have been proposed; however, these algorithms rely on researcher experience to adjust and optimize parameters based on image characteristics, which introduces human error while qualitatively and quantitatively processing bands. Isoelectric focusing (IEF) gel electrophoresis separates proteins with high-resolution based on isoelectric point (pI) differences. Microarray IEF (mIEF) is used for the auxiliary diagnosis of diabetes and adult β-thalassemia owing to operational ease, low sample consumption, and high throughout. This diagnostic method relies on accurately positioning and precisely determining protein bands. To avoid errors associated with correction algorithms during band analysis, this paper introduces a method for rapidly recognizing bands in gel electrophoresis patterns that relies on a deep learning object detection algorithm, and uses it to quantify and classify the IEF electrophoresis pattern of hemoglobin (Hb). We used mIEF experiments to collect 1 665 pI-marker-free Hb IEF images as a model dataset to train the YOLOv8 model. The trained model accepts a Hb IEF image as input and infers band bounding boxes and classification results. Using inference data, the gray intensities of the pixels in each band area are summed to determine the content of each protein. The background and foreground of the image need to be separated prior to summing the abovementioned gray intensities, and the threshold method is used to achieve this. The threshold is defined as the average intensity of the background area, which is obtained by summing and averaging the background intensities of gel areas between the detection bounding boxes of each protein band. The baseline band areas are unified after removing the background. This method only requires the input image, directly outputs the corresponding electrophoretic band information, and does not rely on the experience of professionals nor is it affected by factors such as lane distortion or band deformation. In addition, the developed method does not depend on pI markers for qualitatively determining bands, thereby reducing experimental costs and improving detection efficiency. YOLOv8n delivered a detection accuracy of 92.9% and an inference time of 0.6 ms while using limited computing resources. Using Hb A2 as an example, we compared its content measured using the developed method with clinical data. The quantitative results were subjected to regression analysis, which delivered a linearity of 0.981 2 and a correlation coefficient of 0.980 0. We also used the Bland-Altman analysis method to verify that these two values are highly consistent. Compared with the traditional automatic band detection methods, the method developed in this study is fast, accurate, more repeatable, and stable, and can be used to determine the Hb A2 content in clinical practice, thereby potentially assisting in the auxiliary diagnosis of adult β-thalassemia.

 求助内容:
求助内容: 应助结果提醒方式:


