Nataliia Moshina, Jonas Gjesvik, Tone Hovda, Henrik W Koch, Heinrich A Backmann, Solveig Hofvind
{"title":"Mammographic density by time and breast: a retrospective cohort study from BreastScreen Norway.","authors":"Nataliia Moshina, Jonas Gjesvik, Tone Hovda, Henrik W Koch, Heinrich A Backmann, Solveig Hofvind","doi":"10.1186/s13058-025-02037-2","DOIUrl":null,"url":null,"abstract":"<p><strong>Background: </strong>Mammographic density is known to decrease over time in postmenopausal women. Longitudinal changes in mammographic density prior to breast cancer diagnosis have been widely discussed and less density reduction has been observed for breast developing versus not developing cancer. We aimed to verify these findings among participants of BreastScreen Norway.</p><p><strong>Methods: </strong>In this retrospective cohort study, data from 78,182 women aged 50-69 years who attended three consecutive screening rounds between 2007 and 2020 were included. Among those women, 970 were diagnosed with screen-detected and 308 with interval cancer. Mammographic density data was obtained from an automated software and included absolute (cm<sup>3</sup>) and percent (%) dense volume for each breast and for each woman, per examination. A linear mixed-effects regression model estimating differences in density between the breast developing and not developing cancer was applied to evaluate longitudinal changes, separately for absolute and percent dense volume. The model was adjusted for age at first screening examination, breast volume, follow-up time, history of benign breast disease, body mass index, family history, hormone therapy, use of alcohol and smoking. Results were presented as linear regression coefficient estimates with 95% confidence intervals (CI).</p><p><strong>Results: </strong>Mean age at the third screening examination for women without breast cancer was 62.5 (standard deviation, SD: 5.1) years, while mean age at diagnosis was 62.3 (SD: 4.4) years for women with screen-detected cancer and 61.9 (SD: 4.8) years for women with interval cancer. In our model, absolute and percent dense volume decreased with follow-up time, estimate=-0.010 (95%CI -0.010; -0.009) and estimate=-0.013 (95%CI -0.014; -0.013), respectively, indicating the overall negative effect of time on mammographic density. The interaction between time and development of breast cancer was positive for absolute and percent dense volume, estimate = 0.009 (95%CI 0.004; 0.014) for both, which implied that mammographic density in breasts developing cancer was stable or slightly decreasing.</p><p><strong>Conclusions: </strong>Less reduction in longitudinally assessed mammographic density was observed for breasts developing versus not developing cancer in our study. This difference might be used for more precise 4-6 years breast cancer risk prediction and screening personalization.</p>","PeriodicalId":49227,"journal":{"name":"Breast Cancer Research","volume":"27 1","pages":"83"},"PeriodicalIF":5.6000,"publicationDate":"2025-05-16","publicationTypes":"Journal Article","fieldsOfStudy":null,"isOpenAccess":false,"openAccessPdf":"https://www.ncbi.nlm.nih.gov/pmc/articles/PMC12083168/pdf/","citationCount":"0","resultStr":null,"platform":"Semanticscholar","paperid":null,"PeriodicalName":"Breast Cancer Research","FirstCategoryId":"3","ListUrlMain":"https://doi.org/10.1186/s13058-025-02037-2","RegionNum":1,"RegionCategory":"医学","ArticlePicture":[],"TitleCN":null,"AbstractTextCN":null,"PMCID":null,"EPubDate":"","PubModel":"","JCR":"Q1","JCRName":"Medicine","Score":null,"Total":0}
引用次数: 0
Abstract
Background: Mammographic density is known to decrease over time in postmenopausal women. Longitudinal changes in mammographic density prior to breast cancer diagnosis have been widely discussed and less density reduction has been observed for breast developing versus not developing cancer. We aimed to verify these findings among participants of BreastScreen Norway.
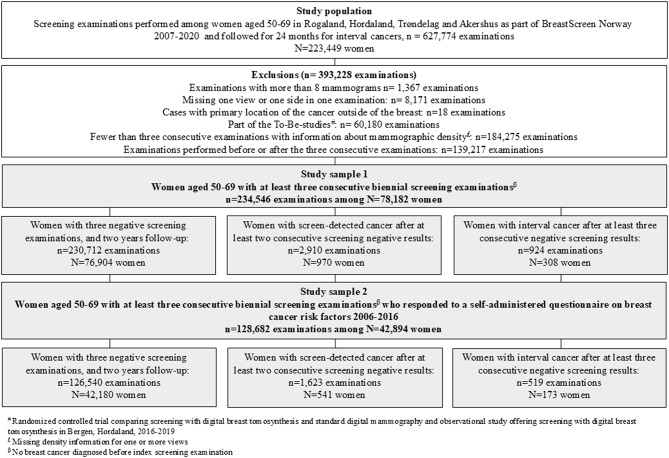
Methods: In this retrospective cohort study, data from 78,182 women aged 50-69 years who attended three consecutive screening rounds between 2007 and 2020 were included. Among those women, 970 were diagnosed with screen-detected and 308 with interval cancer. Mammographic density data was obtained from an automated software and included absolute (cm3) and percent (%) dense volume for each breast and for each woman, per examination. A linear mixed-effects regression model estimating differences in density between the breast developing and not developing cancer was applied to evaluate longitudinal changes, separately for absolute and percent dense volume. The model was adjusted for age at first screening examination, breast volume, follow-up time, history of benign breast disease, body mass index, family history, hormone therapy, use of alcohol and smoking. Results were presented as linear regression coefficient estimates with 95% confidence intervals (CI).
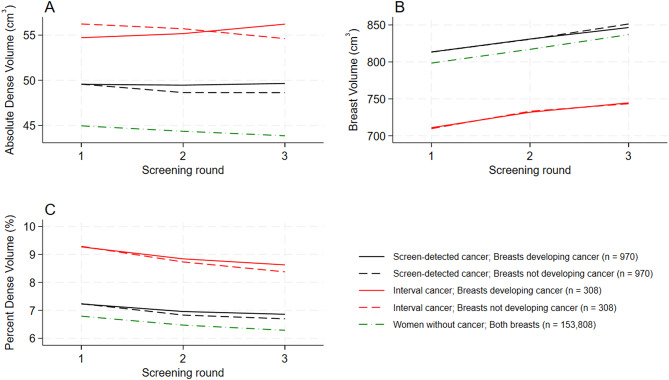
Results: Mean age at the third screening examination for women without breast cancer was 62.5 (standard deviation, SD: 5.1) years, while mean age at diagnosis was 62.3 (SD: 4.4) years for women with screen-detected cancer and 61.9 (SD: 4.8) years for women with interval cancer. In our model, absolute and percent dense volume decreased with follow-up time, estimate=-0.010 (95%CI -0.010; -0.009) and estimate=-0.013 (95%CI -0.014; -0.013), respectively, indicating the overall negative effect of time on mammographic density. The interaction between time and development of breast cancer was positive for absolute and percent dense volume, estimate = 0.009 (95%CI 0.004; 0.014) for both, which implied that mammographic density in breasts developing cancer was stable or slightly decreasing.
Conclusions: Less reduction in longitudinally assessed mammographic density was observed for breasts developing versus not developing cancer in our study. This difference might be used for more precise 4-6 years breast cancer risk prediction and screening personalization.
期刊介绍:
Breast Cancer Research, an international, peer-reviewed online journal, publishes original research, reviews, editorials, and reports. It features open-access research articles of exceptional interest across all areas of biology and medicine relevant to breast cancer. This includes normal mammary gland biology, with a special emphasis on the genetic, biochemical, and cellular basis of breast cancer. In addition to basic research, the journal covers preclinical, translational, and clinical studies with a biological basis, including Phase I and Phase II trials.

 求助内容:
求助内容: 应助结果提醒方式:


