Application of the Nova food classification to the 2017-2018 Household Budget Survey: monitoring adherence to the recommendations of the Dietary Guidelines for the Brazilian Population.
Gabriela Lopes da Cruz, Giovanna Calixto Andrade, Fernanda Rauber, Renata Bertazzi Levy, Maria Laura da Costa Louzada
{"title":"Application of the Nova food classification to the 2017-2018 Household Budget Survey: monitoring adherence to the recommendations of the Dietary Guidelines for the Brazilian Population.","authors":"Gabriela Lopes da Cruz, Giovanna Calixto Andrade, Fernanda Rauber, Renata Bertazzi Levy, Maria Laura da Costa Louzada","doi":"10.1590/S2237-96222025v34e20240369.en","DOIUrl":null,"url":null,"abstract":"<p><strong>Objective: </strong>To describe the food categorization method of the 2017-2018 Household Budget Survey as per the Nova classification, bringing transparency and replicability to the process of monitoring adherence to the recommendations of the Dietary Guidelines for the Brazilian Population.</p><p><strong>Methods: </strong>The foods reported in the Survey were classified in four stages, namely: identification of culinary preparations and items composed of more than one food; determination of the recipe for culinary preparations and items to be disaggregated; application of the Nova classification; sensitivity analysis.</p><p><strong>Results: </strong>After disaggregation, 1,856 items were classified according to the Nova classification, consisting of 1,050 unprocessed or minimally processed foods, 54 processed culinary ingredients, 160 processed foods and 592 ultra-processed foods. Foods whose classification raised questions during the accounted for 4% of the total dietary energy. The contribution of ultra-processed food to total caloric intake varied from 19.7% (95% confidence interval [95%CI] 19.3; 20.1) to 17.7% (95%CI 17.4; 18.1) after conducting sensitivity analysis.</p><p><strong>Conclusion: </strong>Using a standardized method to apply the Nova classification to the Household Budget Survey was effective and led to estimates whose uncertainties minimally affected the overall results. The methodology presented can be replicated in future editions of the Household Budget Survey and other food consumption studies, strengthening food and nutritional surveillance as applied to the Dietary Guidelines.</p>","PeriodicalId":51473,"journal":{"name":"Epidemiologia e Servicos de Saude","volume":"34 ","pages":"e20240369"},"PeriodicalIF":2.0000,"publicationDate":"2025-05-12","publicationTypes":"Journal Article","fieldsOfStudy":null,"isOpenAccess":false,"openAccessPdf":"https://www.ncbi.nlm.nih.gov/pmc/articles/PMC12077547/pdf/","citationCount":"0","resultStr":null,"platform":"Semanticscholar","paperid":null,"PeriodicalName":"Epidemiologia e Servicos de Saude","FirstCategoryId":"1085","ListUrlMain":"https://doi.org/10.1590/S2237-96222025v34e20240369.en","RegionNum":0,"RegionCategory":null,"ArticlePicture":[],"TitleCN":null,"AbstractTextCN":null,"PMCID":null,"EPubDate":"2025/1/1 0:00:00","PubModel":"eCollection","JCR":"Q1","JCRName":"Multidisciplinary","Score":null,"Total":0}
引用次数: 0
Abstract
Objective: To describe the food categorization method of the 2017-2018 Household Budget Survey as per the Nova classification, bringing transparency and replicability to the process of monitoring adherence to the recommendations of the Dietary Guidelines for the Brazilian Population.
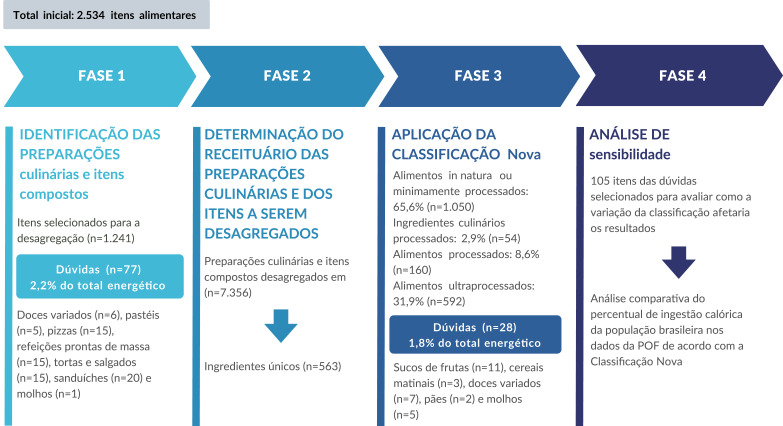
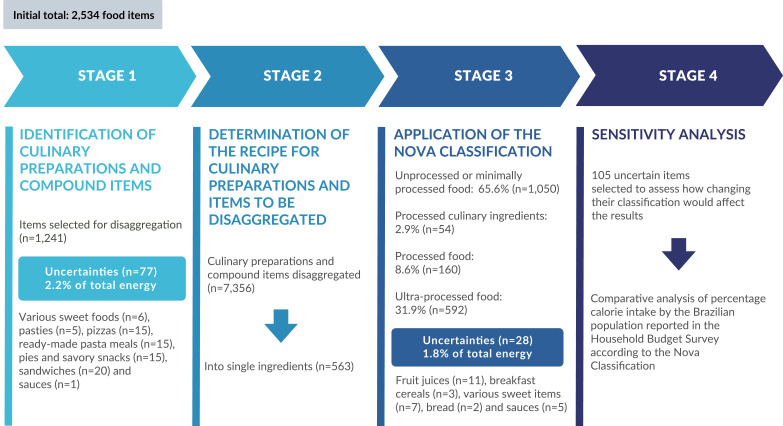
Methods: The foods reported in the Survey were classified in four stages, namely: identification of culinary preparations and items composed of more than one food; determination of the recipe for culinary preparations and items to be disaggregated; application of the Nova classification; sensitivity analysis.
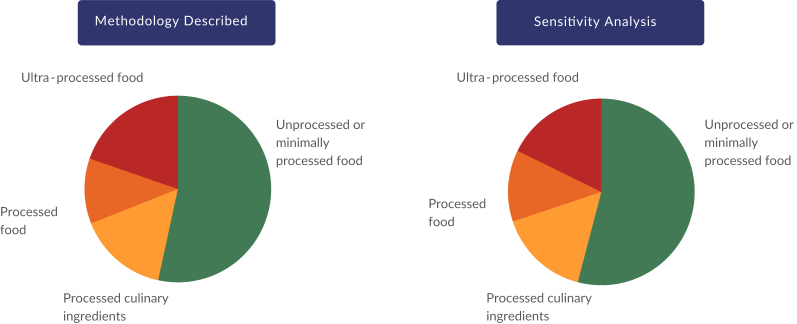
Results: After disaggregation, 1,856 items were classified according to the Nova classification, consisting of 1,050 unprocessed or minimally processed foods, 54 processed culinary ingredients, 160 processed foods and 592 ultra-processed foods. Foods whose classification raised questions during the accounted for 4% of the total dietary energy. The contribution of ultra-processed food to total caloric intake varied from 19.7% (95% confidence interval [95%CI] 19.3; 20.1) to 17.7% (95%CI 17.4; 18.1) after conducting sensitivity analysis.
Conclusion: Using a standardized method to apply the Nova classification to the Household Budget Survey was effective and led to estimates whose uncertainties minimally affected the overall results. The methodology presented can be replicated in future editions of the Household Budget Survey and other food consumption studies, strengthening food and nutritional surveillance as applied to the Dietary Guidelines.

 求助内容:
求助内容: 应助结果提醒方式:


