Parameters of glycemic variability in continuous glucose monitoring as predictors of diabetes: a prospective evaluation in a non-diabetic general population.
Javier Rodríguez García, Felix Camiña Darriba, Juan B Ortolá Devesa, Santiago Rodríguez-Segade Villamarín, Andrea Valle Rodríguez
{"title":"Parameters of glycemic variability in continuous glucose monitoring as predictors of diabetes: a prospective evaluation in a non-diabetic general population.","authors":"Javier Rodríguez García, Felix Camiña Darriba, Juan B Ortolá Devesa, Santiago Rodríguez-Segade Villamarín, Andrea Valle Rodríguez","doi":"10.1515/almed-2025-0011","DOIUrl":null,"url":null,"abstract":"<p><strong>Objectives: </strong>To prospectively examine the ability of some glycemic variability metrics from continuous glucose monitoring (CGM) to predict the development of diabetes in a non-diabetic population.</p><p><strong>Methods: </strong>A total of 497 non-diabetic patients from the AEGIS study were included. Participants used a CGM system (iPro2<sup>®</sup>) over a six-day period. The following parameters were analyzed: standard deviation (SD), coefficient of variation (CV) and mean amplitude of glucose excursion (MAGE). Six-years follow-up was performed. ROC curves were constructed to determine the predictive value of glycemic variability metrics. Sensitivity and specificity were calculated.</p><p><strong>Results: </strong>Of the 497 participants, 16 women (4.9 %) and 9 men (5.2 %) developed diabetes. Initial HbA<sub>1c</sub> and fasting glucose levels were significantly higher in the participants who ultimately developed diabetes. Glycemic variability metrics were also significantly higher in these subjects (SD: 18 vs. 13 mg/dL; CV: 17 vs. 14 %; MAGE: 36 vs. 27 mg/dL; p<0.001 in all cases). SD showed the highest AUC (0.81), with a sensitivity of 80 % and a specificity of 72 % for a cut-off of 14.9 mg/dL. AUCs were higher in men for all metrics.</p><p><strong>Conclusions: </strong>The metrics obtained by MCG, especially SD, are effective predictors of progression to type 2 diabetes in a non-diabetic population. These findings suggest that glycemic variability is useful for the early identification of subjects at a higher risk of developing diabetes.</p>","PeriodicalId":72097,"journal":{"name":"Advances in laboratory medicine","volume":"6 1","pages":"46-51"},"PeriodicalIF":1.1000,"publicationDate":"2025-03-07","publicationTypes":"Journal Article","fieldsOfStudy":null,"isOpenAccess":false,"openAccessPdf":"https://www.ncbi.nlm.nih.gov/pmc/articles/PMC11949551/pdf/","citationCount":"0","resultStr":null,"platform":"Semanticscholar","paperid":null,"PeriodicalName":"Advances in laboratory medicine","FirstCategoryId":"1085","ListUrlMain":"https://doi.org/10.1515/almed-2025-0011","RegionNum":0,"RegionCategory":null,"ArticlePicture":[],"TitleCN":null,"AbstractTextCN":null,"PMCID":null,"EPubDate":"2025/3/1 0:00:00","PubModel":"eCollection","JCR":"Q4","JCRName":"MEDICAL LABORATORY TECHNOLOGY","Score":null,"Total":0}
引用次数: 0
Abstract
Objectives: To prospectively examine the ability of some glycemic variability metrics from continuous glucose monitoring (CGM) to predict the development of diabetes in a non-diabetic population.
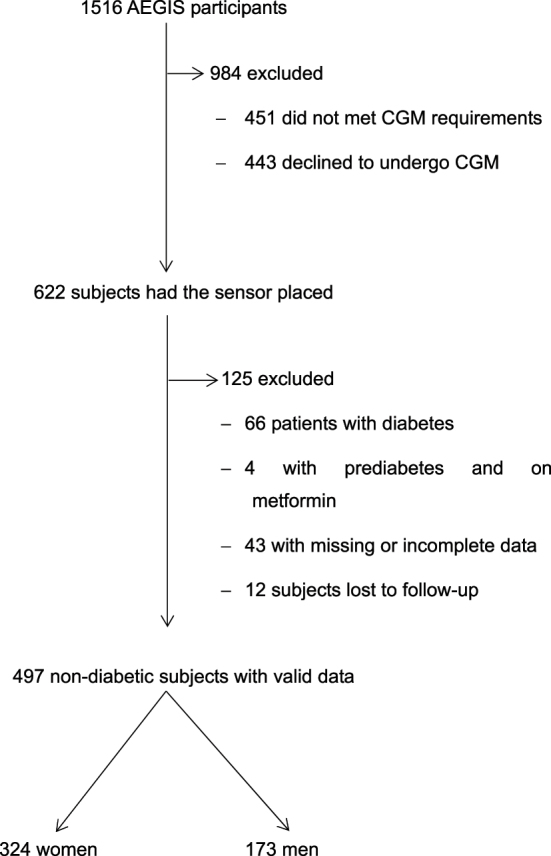
Methods: A total of 497 non-diabetic patients from the AEGIS study were included. Participants used a CGM system (iPro2®) over a six-day period. The following parameters were analyzed: standard deviation (SD), coefficient of variation (CV) and mean amplitude of glucose excursion (MAGE). Six-years follow-up was performed. ROC curves were constructed to determine the predictive value of glycemic variability metrics. Sensitivity and specificity were calculated.
Results: Of the 497 participants, 16 women (4.9 %) and 9 men (5.2 %) developed diabetes. Initial HbA1c and fasting glucose levels were significantly higher in the participants who ultimately developed diabetes. Glycemic variability metrics were also significantly higher in these subjects (SD: 18 vs. 13 mg/dL; CV: 17 vs. 14 %; MAGE: 36 vs. 27 mg/dL; p<0.001 in all cases). SD showed the highest AUC (0.81), with a sensitivity of 80 % and a specificity of 72 % for a cut-off of 14.9 mg/dL. AUCs were higher in men for all metrics.
Conclusions: The metrics obtained by MCG, especially SD, are effective predictors of progression to type 2 diabetes in a non-diabetic population. These findings suggest that glycemic variability is useful for the early identification of subjects at a higher risk of developing diabetes.
目的:前瞻性地研究一些来自连续血糖监测(CGM)的血糖变异性指标在非糖尿病人群中预测糖尿病发展的能力。方法:纳入来自AEGIS研究的497例非糖尿病患者。参与者在六天的时间内使用CGM系统(iPro2®)。分析以下参数:标准差(SD)、变异系数(CV)和葡萄糖偏移平均幅度(MAGE)。随访6年。构建ROC曲线以确定血糖变异性指标的预测价值。计算敏感性和特异性。结果:在497名参与者中,16名女性(4.9 %)和9名男性(5.2 %)患糖尿病。在最终发展为糖尿病的参与者中,初始HbA1c和空腹血糖水平明显更高。这些受试者的血糖变异性指标也显著较高(SD: 18 vs. 13 mg/dL;CV: 17 vs. 14 %;MAGE: 36 vs. 27 mg/dL;结论:MCG获得的指标,尤其是SD,是非糖尿病人群进展为2型糖尿病的有效预测指标。这些发现表明,血糖变异性对早期识别患糖尿病风险较高的受试者是有用的。

 求助内容:
求助内容: 应助结果提醒方式:


