Qingxuan Xiao, Na Xie, Xinyang Xiang, Ting Cao, Yingye Xie, Xiang Liang, Xiaoyan Su
{"title":"The value of the phase angle of bioelectrical impedance analysis to predict malnutrition in hemodialysis patients.","authors":"Qingxuan Xiao, Na Xie, Xinyang Xiang, Ting Cao, Yingye Xie, Xiang Liang, Xiaoyan Su","doi":"10.3389/fneph.2025.1478367","DOIUrl":null,"url":null,"abstract":"<p><strong>Objectives: </strong>To investigate the validity of bioelectrical impedance analysis (BIA)-derived phase angle (PhA) as a predictor of malnutrition in maintenance hemodialysis (MHD) patients.</p><p><strong>Methods: </strong>A single-center, cross-sectional study of 126 MHD patients was conducted. A diagnosis of malnutrition was based on the 7-point Subjective Global Assessment (7-p-SGA) criteria. A Bioelectrical Impedance Analyzer was used to determine the PhA, fat mass (FM), muscle mass, and extracellular water/total body water (ECW/TBW) ratio. Biochemical indices and anthropometric measurements were also assessed. Using 7-p-SGA criteria, the patients were categorized into two groups: well-nourished and malnourished. General patient characteristics and the PhA values were compared between the two groups. A correlation analysis examined the relationship between PhA and the nutritional index. Logistic regression models and receiver operating characteristic curve analyses were used to identify independent factors for predicting malnutrition and determining their respective cutoff values.</p><p><strong>Results: </strong>The malnourished group had a significantly lower PhA than the well-nourished group (5.19° (5.81°, 4.09°) vs 6.13° (6.80°, 5.49°), <i>P</i> < 0.001). The PhA correlated positively with body mass index (BMI), albumin (Alb), and handgrip strength (HGS) (<i>P</i> < 0.05). However, there were no significant associations between PhA and FM or triceps skinfold thickness (TSF) (P > 0.05). Multivariate logistic regression analysis revealed that PhA, Alb, and BMI were independent predictors of malnutrition. Of these, BMI was the strongest predictor [odds ratio (OR) = 0.68; <i>P</i> < 0.001]. PhA also served as a secondary predictor of malnutrition (OR = 0.588; <i>P</i> = 0.035). Receiver operating characteristic curve analysis indicated that a PhA threshold value of approximately 5.78° was optimal for predicting malnutrition.</p><p><strong>Conclusion: </strong>PhA is a straightforward and reliable predictor of malnutrition in MHD patients, with an optimal cut-off value of 5.78° identified for diagnosing this condition.</p>","PeriodicalId":73091,"journal":{"name":"Frontiers in nephrology","volume":"5 ","pages":"1478367"},"PeriodicalIF":0.0000,"publicationDate":"2025-03-03","publicationTypes":"Journal Article","fieldsOfStudy":null,"isOpenAccess":false,"openAccessPdf":"https://www.ncbi.nlm.nih.gov/pmc/articles/PMC11911513/pdf/","citationCount":"0","resultStr":null,"platform":"Semanticscholar","paperid":null,"PeriodicalName":"Frontiers in nephrology","FirstCategoryId":"1085","ListUrlMain":"https://doi.org/10.3389/fneph.2025.1478367","RegionNum":0,"RegionCategory":null,"ArticlePicture":[],"TitleCN":null,"AbstractTextCN":null,"PMCID":null,"EPubDate":"2025/1/1 0:00:00","PubModel":"eCollection","JCR":"","JCRName":"","Score":null,"Total":0}
引用次数: 0
Abstract
Objectives: To investigate the validity of bioelectrical impedance analysis (BIA)-derived phase angle (PhA) as a predictor of malnutrition in maintenance hemodialysis (MHD) patients.
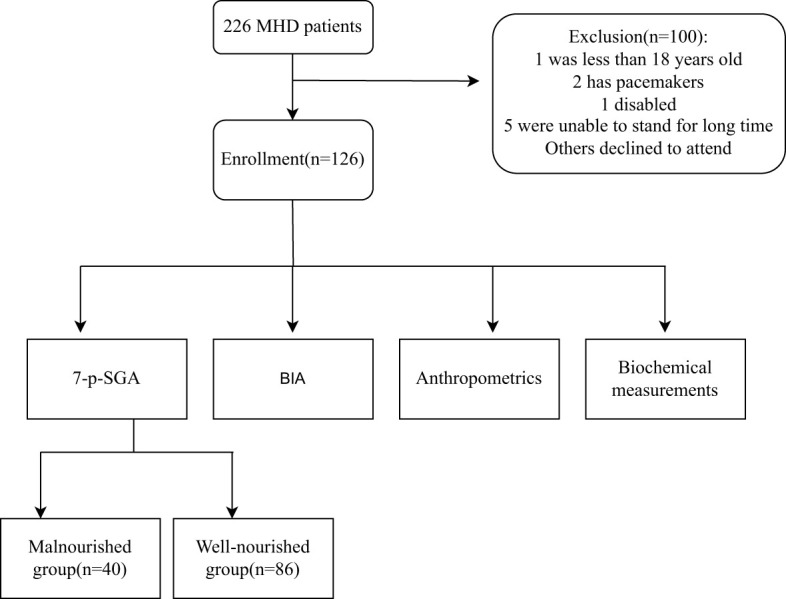
Methods: A single-center, cross-sectional study of 126 MHD patients was conducted. A diagnosis of malnutrition was based on the 7-point Subjective Global Assessment (7-p-SGA) criteria. A Bioelectrical Impedance Analyzer was used to determine the PhA, fat mass (FM), muscle mass, and extracellular water/total body water (ECW/TBW) ratio. Biochemical indices and anthropometric measurements were also assessed. Using 7-p-SGA criteria, the patients were categorized into two groups: well-nourished and malnourished. General patient characteristics and the PhA values were compared between the two groups. A correlation analysis examined the relationship between PhA and the nutritional index. Logistic regression models and receiver operating characteristic curve analyses were used to identify independent factors for predicting malnutrition and determining their respective cutoff values.
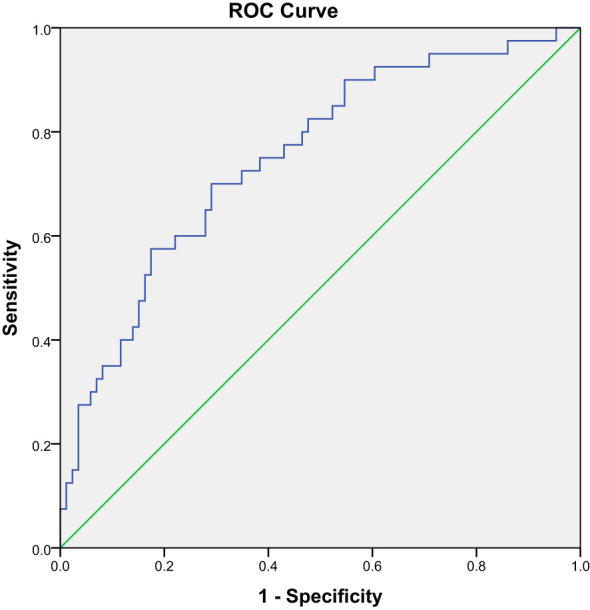
Results: The malnourished group had a significantly lower PhA than the well-nourished group (5.19° (5.81°, 4.09°) vs 6.13° (6.80°, 5.49°), P < 0.001). The PhA correlated positively with body mass index (BMI), albumin (Alb), and handgrip strength (HGS) (P < 0.05). However, there were no significant associations between PhA and FM or triceps skinfold thickness (TSF) (P > 0.05). Multivariate logistic regression analysis revealed that PhA, Alb, and BMI were independent predictors of malnutrition. Of these, BMI was the strongest predictor [odds ratio (OR) = 0.68; P < 0.001]. PhA also served as a secondary predictor of malnutrition (OR = 0.588; P = 0.035). Receiver operating characteristic curve analysis indicated that a PhA threshold value of approximately 5.78° was optimal for predicting malnutrition.
Conclusion: PhA is a straightforward and reliable predictor of malnutrition in MHD patients, with an optimal cut-off value of 5.78° identified for diagnosing this condition.

 求助内容:
求助内容: 应助结果提醒方式:


