{"title":"Energy and protein intake threshold modelling using nutrition dashboard technology and sensitivity of hospital malnutrition identification.","authors":"Erin Fisher, Leanne Brown, Kerith Duncanson","doi":"10.1111/1747-0080.70007","DOIUrl":null,"url":null,"abstract":"<p><strong>Aims: </strong>Hospital food provision/intake dashboards may improve malnutrition screening. The aim of this study was to use Nutrition Dashboard data to determine the optimal threshold for screening for malnutrition risk, and compare the accuracy of this method with estimated dietary requirements.</p><p><strong>Methods: </strong>Observational data were extracted from medical files and food service records of 267 patients for a 4-month period in a 99-bed hospital. Energy (2500-8000 kJ) and protein (30-90 g) thresholds were applied for Nutrition Dashboard categorisation by supply and intake of food. Deficits in estimated requirements (105 kJ/kg/day and 0.75 g/kg/day) were also applied as a comparative method. The association between Nutrition Dashboard categories and the Malnutrition Screening Tool was explored using generalised estimating equations.</p><p><strong>Results: </strong>A total of 267 patients and 1908 days of data were analysed. The use of estimated requirements for Nutrition Dashboard categorisation was not a statistically significant predictor of malnutrition risk. Application of energy (≤6000 kJ) and protein (≤65 g) thresholds for categorisation was significant (χ<sup>2</sup> = 9.50, df = 3, p = 0.023). When 5000 kJ and 55 g of protein were used for categorisation, patients were more likely to be at malnutrition risk when within low supply (odds ratio = 2.11, p = 0.002) and low intake (odds ratio 2.23, p < 0.001) categories.</p><p><strong>Conclusions: </strong>Nutrition Dashboard categories are associated with an increased risk of malnutrition when categorised using thresholds of up to 6000 kJ and 65 g protein. Technologies like the Nutrition Dashboard present innovative opportunities for dietitians to utilise nutrition informatics to enhance and optimise nutrition care.</p>","PeriodicalId":19368,"journal":{"name":"Nutrition & Dietetics","volume":" ","pages":"363-372"},"PeriodicalIF":3.2000,"publicationDate":"2025-09-01","publicationTypes":"Journal Article","fieldsOfStudy":null,"isOpenAccess":false,"openAccessPdf":"https://www.ncbi.nlm.nih.gov/pmc/articles/PMC12401800/pdf/","citationCount":"0","resultStr":null,"platform":"Semanticscholar","paperid":null,"PeriodicalName":"Nutrition & Dietetics","FirstCategoryId":"3","ListUrlMain":"https://doi.org/10.1111/1747-0080.70007","RegionNum":4,"RegionCategory":"医学","ArticlePicture":[],"TitleCN":null,"AbstractTextCN":null,"PMCID":null,"EPubDate":"2025/3/17 0:00:00","PubModel":"Epub","JCR":"Q3","JCRName":"NUTRITION & DIETETICS","Score":null,"Total":0}
引用次数: 0
Abstract
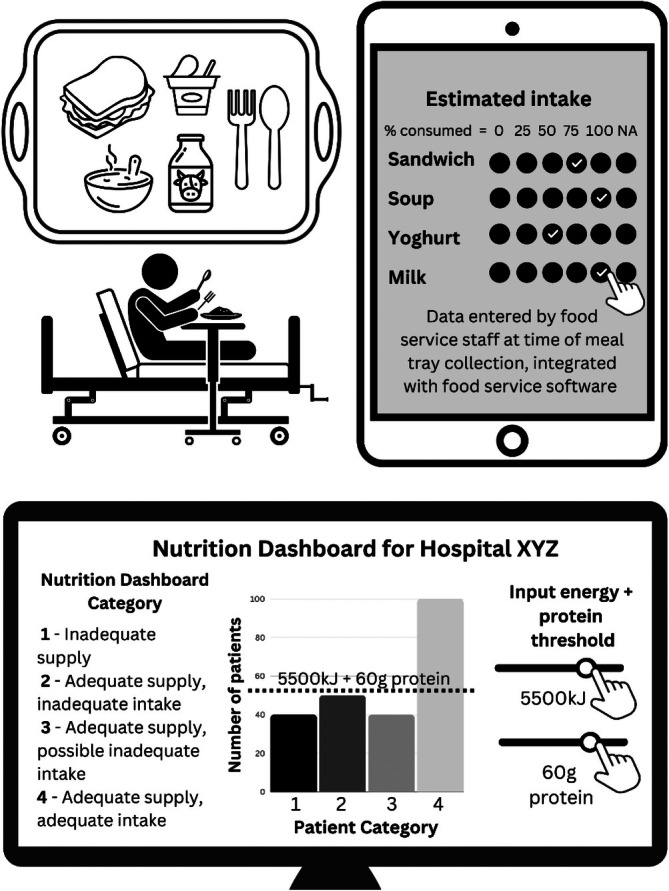
Aims: Hospital food provision/intake dashboards may improve malnutrition screening. The aim of this study was to use Nutrition Dashboard data to determine the optimal threshold for screening for malnutrition risk, and compare the accuracy of this method with estimated dietary requirements.
Methods: Observational data were extracted from medical files and food service records of 267 patients for a 4-month period in a 99-bed hospital. Energy (2500-8000 kJ) and protein (30-90 g) thresholds were applied for Nutrition Dashboard categorisation by supply and intake of food. Deficits in estimated requirements (105 kJ/kg/day and 0.75 g/kg/day) were also applied as a comparative method. The association between Nutrition Dashboard categories and the Malnutrition Screening Tool was explored using generalised estimating equations.
Results: A total of 267 patients and 1908 days of data were analysed. The use of estimated requirements for Nutrition Dashboard categorisation was not a statistically significant predictor of malnutrition risk. Application of energy (≤6000 kJ) and protein (≤65 g) thresholds for categorisation was significant (χ2 = 9.50, df = 3, p = 0.023). When 5000 kJ and 55 g of protein were used for categorisation, patients were more likely to be at malnutrition risk when within low supply (odds ratio = 2.11, p = 0.002) and low intake (odds ratio 2.23, p < 0.001) categories.
Conclusions: Nutrition Dashboard categories are associated with an increased risk of malnutrition when categorised using thresholds of up to 6000 kJ and 65 g protein. Technologies like the Nutrition Dashboard present innovative opportunities for dietitians to utilise nutrition informatics to enhance and optimise nutrition care.
期刊介绍:
Nutrition & Dietetics is the official journal of the Dietitians Association of Australia. Covering all aspects of food, nutrition and dietetics, the Journal provides a forum for the reporting, discussion and development of scientifically credible knowledge related to human nutrition and dietetics. Widely respected in Australia and around the world, Nutrition & Dietetics publishes original research, methodology analyses, research reviews and much more. The Journal aims to keep health professionals abreast of current knowledge on human nutrition and diet, and accepts contributions from around the world.
 求助内容:
求助内容: 应助结果提醒方式:


